

[ad_1]
The S&P 500 closed up 2.65% on Monday, reversing a 2%+ drop on Friday. That too reversed a prior move: a rise of more than 2% on Thursday. This brings the total to six daily moves bigger than 2% this month, compared with only two in September, and we are only halfway through the month. What’s going on?
The catalyst for the move was Bank of America’s surprisingly strong quarterly earnings report that beat expectations. It came right alongside the news of a complete U-turn of the U.K. Prime Minister Liz Truss’s tax plan, which had rattled markets. Remarkably, every one of the 11 S&P 500 sectors finished higher. In fact, nearly every stock in the index rose.
First, 2% days aren’t especially common: less than 7% of all trading days in the index extend beyond 2%. But streaks of three 2% days – Thursday, Friday and then Monday – are even less common. In fact, according to the Bespoke Group blog, there have been only 25 going back to the 1990s and 11 of those extended to a fourth day.
More to the point, the average daily moves have been rising in the past few months to levels that are reminiscent of some tough periods in history. But it’s also an inevitable part of the bottoming process.
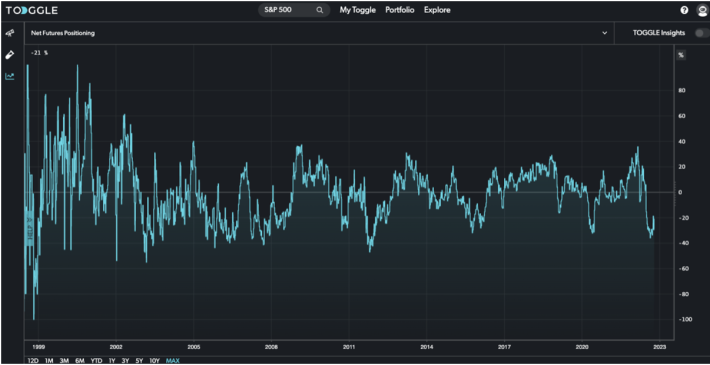
By this point in the bear market, many investors are out of the market entirely or – as the chart below shows – have hedged their longs with short positions in liquid instruments like SPX futures. In fact, speculative short positions in SPX futures reached a level not seen in over 10 years. This kind of setup creates a very fertile ground for powerful short squeezes on good news like we saw on Monday, only to reverse again when bears reassert themselves.
Ok, but is all this volatility good for the market outlook? Yes, but only marginally. Volatility of that magnitude usually appears closer to the low rather than the peak of a bear market.
For example, the intraday swing like the S&P 500 experienced on Thursday – it dropped almost 2.5% before finishing up over 2.5% – is exceedingly rare. There have only been nine other times since 1983 with the intra-day range that wide. According to Bespoke Group data, the S&P typically declined more over the next three months but rose an average of almost 15% in the 12 months after.
Buckle up.
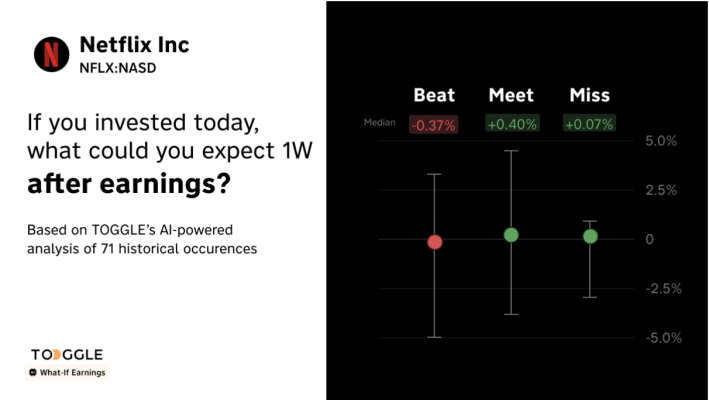
Idea Spotlight: Netflix (NFLX)
Analyst revision indicators for NFLX are coming down, and historically, this led to a median increase in price of 10.49% over the following 1M. TOGGLE analyzed 9 similar occasions in the past to produce the median projection and this insight received 5 out of 8 stars in our quality assessment.
Netflix is set to announce earnings post-market after launching a new ad-supported tier. Here’s what you could expect:
The views and opinions expressed herein are the views and opinions of the author and do not necessarily reflect those of Nasdaq, Inc.
[ad_2]
Image and article originally from www.nasdaq.com. Read the original article here.