[ad_1]
by Chris Vermeulen of The Technical Traders
I just did some research and wrote about it. I should be clear that you may find this article a little unsettling if you are nearing retirement or have already retired. On the other hand, it’s an eye-opener because the financial markets and different asset prices paint an interesting picture.
But, I believe being armed with the proper information and knowledge leads to better outcomes, so I’m sharing this possible scenario that could unfold in the next 3-10 months and last for many years and directly affect our lifestyle.
If you don’t take proper action, you could be exposed to and experience something called the sequence of returns risk, which I will explain in great detail in my soon-to-publish white paper, so be sure to join the free newsletter. So, let’s jump into things!
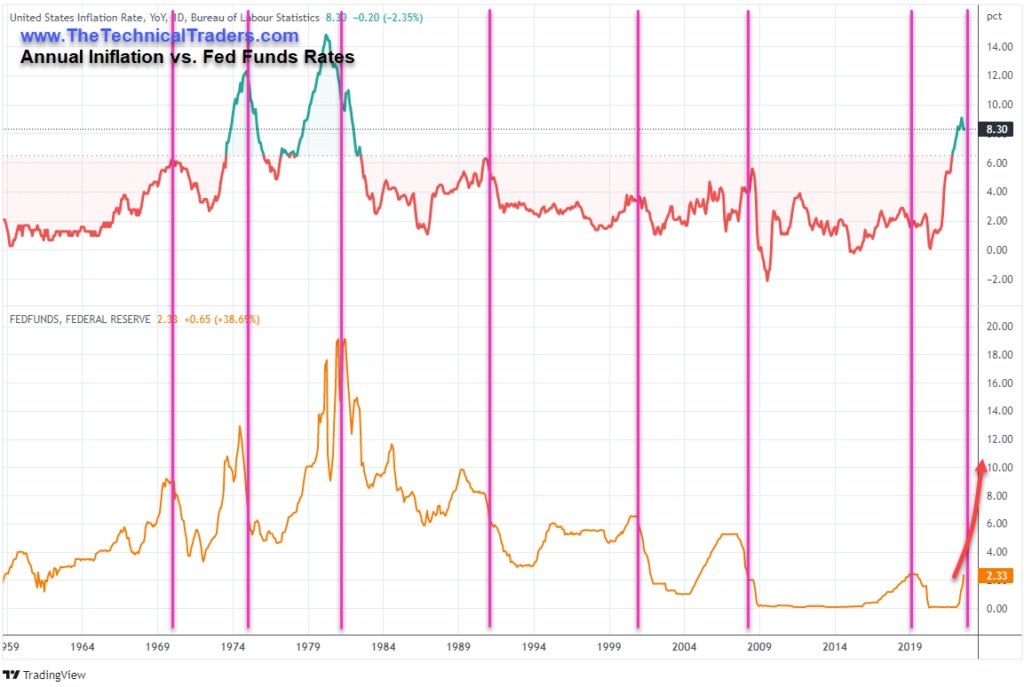
There is a concept that the US Fed may be pushed into raising rates above nominal inflation rates to stall inflationary trends. Historically, the US Federal Reserve had raised rates aggressively to near or above annual inflation rates before the US economy moved away from inflation trends.
THE POTENTIAL SCENARIO AS TOLD BY THE CHARTS AND HISTORY
Suppose US Inflation trends continue to stay elevated throughout the end of 2022 and into early 2023. In that case, the US Fed may continue to raise Fed Funds Rates (FFR) to unimaginable levels more quickly than many traders/investors consider possible. Could you imagine an FFR rate above 6.5%? How about 8.5%?
What would that do to the Mortgage/Housing market? How would consumers react to credit card interest rates above 24% and mortgages above 10%? Do you think this could happen before inflation trends break downward?
The reality is that the markets and future have a way of surprising us and doing what we once thought was not possible. So being open to some of these extreme measures and situations is something we should consider and consider what they could do to our businesses, lifestyles, and retirement.
Historically, this must happen for the US Fed to break the persistent inflationary trends in the US – take a look at this chart.
The best-case scenario given the historical example is that Annual Inflation trends move aggressively to the downside by Q1:2023 or earlier. That will allow the US Fed to move away from more aggressive rate increases, which could significantly disrupt US & Global asset markets (pretty much everything).
Suppose Annual Inflation stays above 6~7% throughout the end of 2022 and into early 2023. In that case, I believe it is very likely the US Federal Reserve will be pushed to continue raising rates until a definite downward trend is established in inflation.
ALGOS, ILLIQUIDITY, DERIVATIVES ARE ACTIVE CULPRITS
There are two examples showing the US Fed acted ahead of a major downturn in inflation: one in the late 1980s and another in late 2007. Both instances were unique in the sense that the late 1980s presented similar sets of circumstances. Computerized trading, illiquidity, and excessive Derivatives exposure prompted the 1987 Black Monday crash and the 2007-08 Global Financial Crisis. (Source: historynewsnetwork.org/article/895)
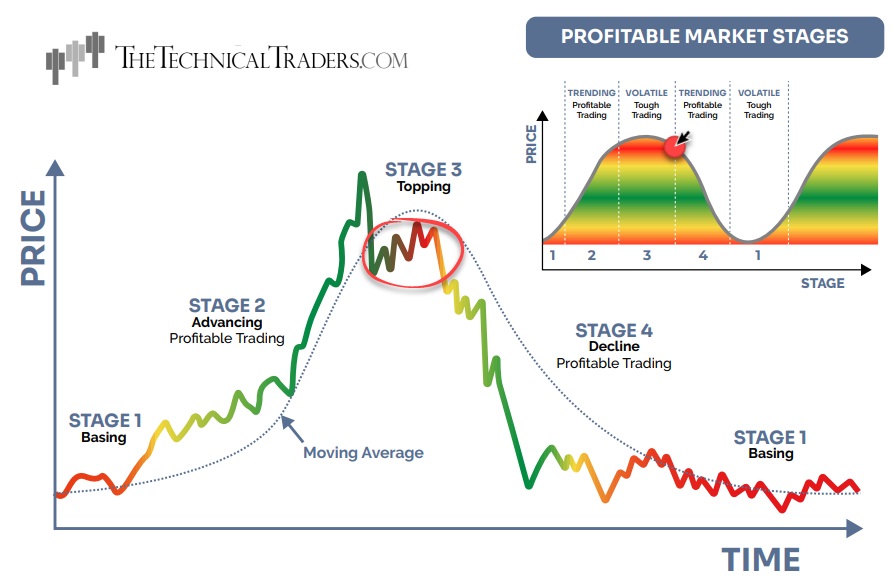
CURRENT STAGE 3 TOPPING PATTERN MAY TURN INTO STAGE 4 DECLINE
My research suggests the US markets are fragile given the current Inflationary trends and pending Federal Reserve rate increases. As I told above, the best-case example is to see Inflation levels dramatically decline before the end of Q1:2023. It is almost essential that current inflation levels drop back to 2~3% very quickly if we are going to see any measurable slowdown in Fed rate increases.
Secondly, the continued speculation by traders/investors remains very high, in my opinion. Given the historical example, traders should be pulling capital away from risks very quickly and attempting to wait out any potential Fed rate decisions. Below, I’ve highlighted where I believe we are on the Stock Market Stages chart. This is not the time to become overly aggressive with your retirement account/nest egg.
Many traders and investors are now buying this pullback in stocks, thinking it’s a buy-the-dip type of play. I think things are about to get ugly, and what we have seen thus far in 2022 is just the 12-year bull market ending, but the downtrend has not even started yet.
The time to buy the hottest sectors, like in 2020, will eventually come, and when it does, the Best Asset Now strategy (BAN) can generate explosive growth for traders, but now is not the time.
PROPRIETARY INVESTOR STRATEGY CONFIRMS CYCLE TRENDS
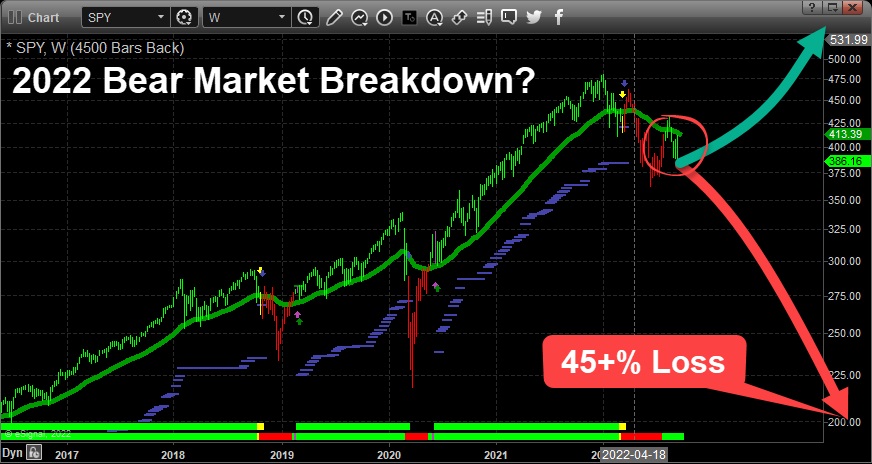
My proprietary Technical Investor strategy (TTI) has moved into GREEN trending bars – aligning very closely with the MAGENTA ARROW on the Stock Market Stages chart above. I’ve drawn both a GREEN & RED arrow on this chart to highlight the potential trending outcomes that likely depend on how quickly Inflation levels drop.
If Annual Inflation levels drop below 3% before we start Q2:2023, then I believe we may see a softer US Fed and more significant potential for a recovery in the US/Global markets over the next 18+ months.
On the other hand, suppose Annual Inflation levels stay above 6~7% over the next 6+ months. In that case, I believe the US Federal Reserve will attempt to continue to raise rates aggressively – eventually resulting in a “bear market” breakdown event in the US/Global asset markets.
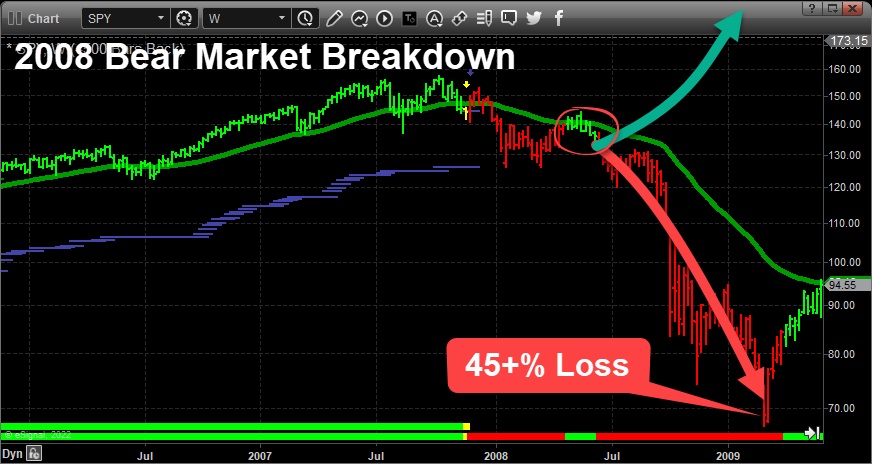
COMPARING 2008 BEAR MARKET BREAKDOWN WITH 2022 PRICE ACTION
The last time we experienced a major Inflationary event where the US Federal Reserve was not actively supporting the US economy with QE policies was in 2007-08. This event prompted a -57% decline in the SPY before bottoming out and a -55% decline in the QQQ. Many of you lived through that market collapse and have strong feelings about how destructive that move was for everyone.
2022 BEAR MARKET BREAKDOWN
This time, after 12+ years of QE, prompting the “Everything Bubble,” – just imagine what could happen if my research is correct. But let me be very here. I am not forecasting, predicting, or saying this will happen. I do things differently when it comes to trading and investing. I only own assets and hold positions that are rising in value. I do this by following price charts and managing risk and positions.
You won’t ever catch me trying to pick a bottom, averaging down into losing positions, and you won’t find me trying to pick a top, either. What you will experience if you follow my work is that I always research and know all the possibilities an asset could move, and I plan to navigate each one safely. Once the price charts confirm a direction, I position my portfolio to profit from the new trend, which can be up or down.
A TOUGH YEAR EVEN FOR EXPERIENCED INVESTORS
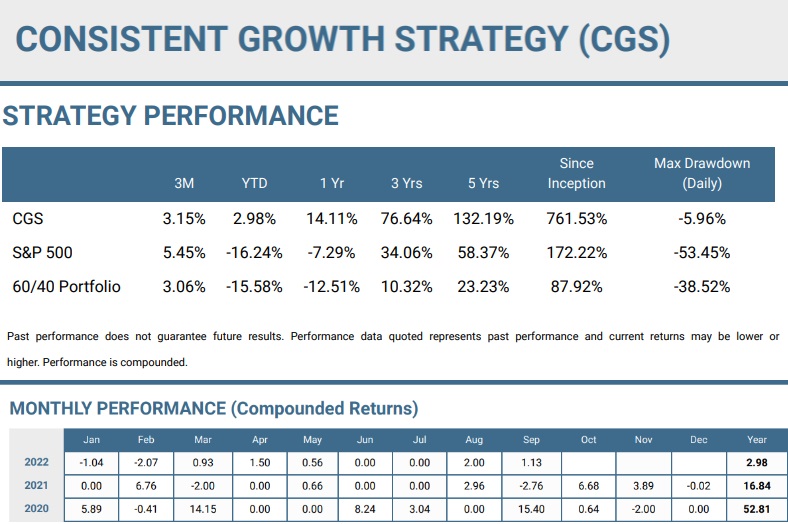
This year alone, the S&P 500 is down over 18%, and treasury bond ETF TLT is down 28%. As a result, anyone investor using the buy-and-hold strategy with any mix of stocks/bonds in their portfolio is under tremendous pressure and likely starting to worry about outliving their retirement funds.
Here is a little background on the market markets for you. First, there have been 26 bear markets since 1929, with an average loss of 35.62 percent and an average duration of 289 days. Mind you, some of those bear markets were only a few months long, while others were multi-year declines, with some taking 5, 12, and even 17 years to return to breakeven.
But the reality is breaking even with your assets is still a significant loss. After many years of being in a drawdown like that, don’t forget you are paying 0.50% – 2% annual fees from ETFs, mutual funds, and possibly advisor fees. Simple math shows that with a 17-year drawdown spending 1+% year to hold these losing positions, you still have a 17+% loss when assets return to breakeven because of these costs.
I know all this sounds bleak, and rightly so, it is. But there is good news. Market corrections and bear markets can be identified early and safely navigated if you know what to look for and follow the market VS. buy and hope, or try to pick market bottoms and tops.
2022 has been a very tough year to make money from the markets, not because of the market decline but because of the stage 3 phase in which the stock market is currently. It does not know if it wants to find a bottom and rally or roll over and start a steep bear market swan dive.
You can see how my Consistent Growth Strategy (CGS) has preserved our capital during these difficult times.
CONCLUDING THOUGHTS:
In short, the world and even more so, the financial markets and assets have a habit of applying the maximum pain to investors before reversing direction. In fact, there is a “Max Pain” calculation in the options market to know where the maximum pain/losses will be for the stock market, and it’s crazy scary how the market will reach this price level during options expiry days on many cases.
The bottom line here is that the worst thing that could happen to most investors and capital in the markets now would be a multi-year bear market and drawdown in the markets, which would cripple anyone nearing retirement and everyone already retired. Having your nest egg cut in half will send shockwaves worldwide to the largest group of investors, the baby boomers, and anyone retired. In addition, it will likely create a flood of people looking for jobs to subsidize their retirement and crush many dreams, and that’s just the beginning of potentially a big unraveling of the economy, I think.
Labor rates will fall as millions of individuals look for work, we will be in a recession, and businesses will be laying off millions of employees, making it even harder to get a job. We are already seeing layoffs taking place. Then we could see the real estate market (residential and commercial) starting to fall apart. Things start to get a little depressing beyond that, so I’ll stop here, but you get my gist, I hope.
The average investor is positioned for higher prices with the buy-and-hold strategy. The critical thing I am trying to share with you is what could happen on the downside if things continue to erode and that you should think about how your lifestyle could change in the next 3-10 months if/when this happens and if you think you will be comfortable with your situation.
Every week I remind investors I work with that now is not the time to expect to make money. Instead, it is about capital preservation. Focus on not losing; growth will naturally come in due time.
If you have any questions, my team and I are here to help you safely navigate both bull markets and bear markets with our CGS Investing Strategy.
Chris Vermeulen
Chief Investment Officer
www.TheTechnicalTraders.com
Disclaimer: This and any information contained herein should not be considered investment advice. Technical Traders Ltd. and its staff are not registered investment advisors. Under no circumstances should any content from websites, articles, videos, seminars, books or emails from Technical Traders Ltd. or its affiliates be used or interpreted as a recommendation to buy or sell any security or commodity contract. Our advice is not tailored to the needs of any subscriber so talk with your investment advisor before making trading decisions. Invest at your own risk. I may or may not have positions in any security mentioned at any time and maybe buy sell or hold said security at any time.
[ad_2]
Image and article originally from www.investmentwatchblog.com. Read the original article here.

