[ad_1]
The price of Ethereum (ETH) has struggled against Tether (USDT) in the past few days, with more downtrend than the bullish sentiment seen in recent weeks.
Despite outperforming Bitcoin (BTC) in recent weeks, the price of Ethereum has found itself in key zones that would decide its major move.
Ethereum (ETH) Price Analysis On The Weekly Chart
From the chart, the price of ETH saw a weekly low of $1,020, which bounced from that area and rallied to a price of $2,000 after showing great recovery signs in recent weeks.
ETH weekly candle closed with a bullish sentiment, with the new week’s candle looking bearish for the price of ETH as it continued to decline in price to a region of $1,800 after facing rejection from the $2,020 mark.
The price has struggled to build more momentum as it tries to hold key support.
If the price of ETH on the weekly chart continues with this structure, it could quickly revisit $1,700, acting as a support for the price of ETH.
Weekly resistance for the price of ETH – $2,020.
Weekly support for the price of ETH – $1,700.
Price Of Ethereum On The Daily (1D) Chart

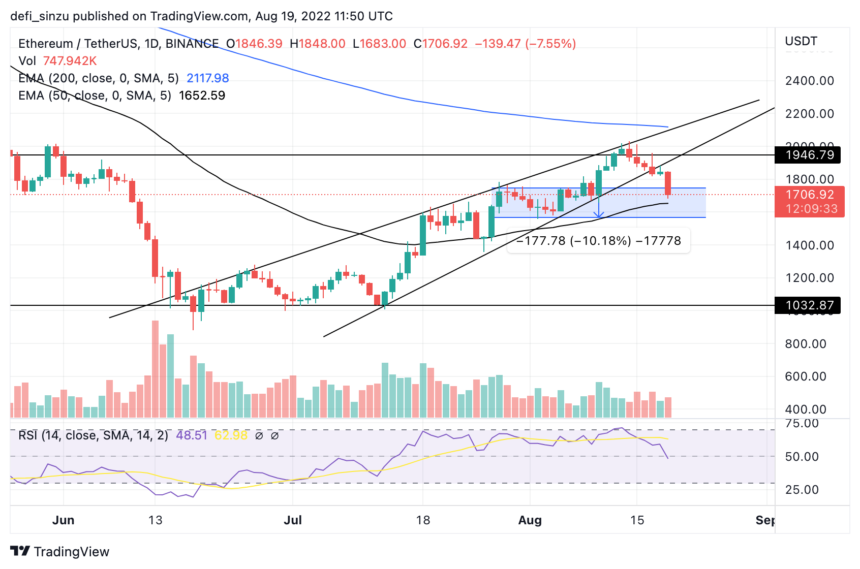
The price of ETH found strong support at $1,770 above a trendline after successfully forming a bullish structure, the support at $1,770 seems to be an area of interest on the daily chart.
ETH bounced from its support and rallied to $1,770, where it was faced with resistance and was rejected from that region.
The price of ETH rose to form a rising wedge before rejection from the resistance of $2,020. ETH price was rejected from that region, breaking out of the rising wedge to the downside.
At the time of writing, the price of ETH is at $1,700, just above the 50 Exponential Moving Average (EMA) which corresponds to $1,660.
ETH needs to hold above this support area that corresponds with the 50 EMA, a break below this region could send the price of ETH to $1,400.
The Relative Strength Index (RSI) for the price of ETH on the daily chart is below 50, indicating more sell bids.
Daily (1D) resistance for ETH price – $2,020.
Daily (1D) support for ETH price – $1,700, $1,660 .
Price Analysis Of ETH On The Four-Hourly (4H) Chart

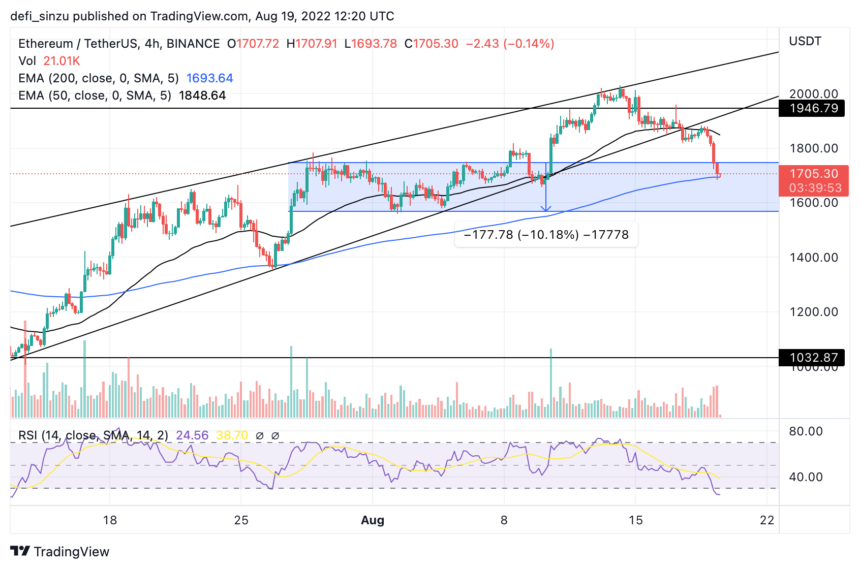
The price of ETH failed to sustain its bullish structure above the 50 EMA price corresponding to $1,850 after breaking below it.
On the 4H timeframe, the 200 EMA is acting as key support for the price of ETH.
If ETH fails to hold the support region at 200 EMA, which corresponds to $1,700, we could see the price retesting the region of $1,600 as the next support area to hold the ETH price.
Four-Hourly (4H) resistance for ETH price – $2,020.
Four-Hourly (4H) support for ETH price – $1,700, $1,600.
Featured Image From Ethereum World, Charts from TradingView.com
[ad_2]
Image and article originally from www.newsbtc.com. Read the original article here.

