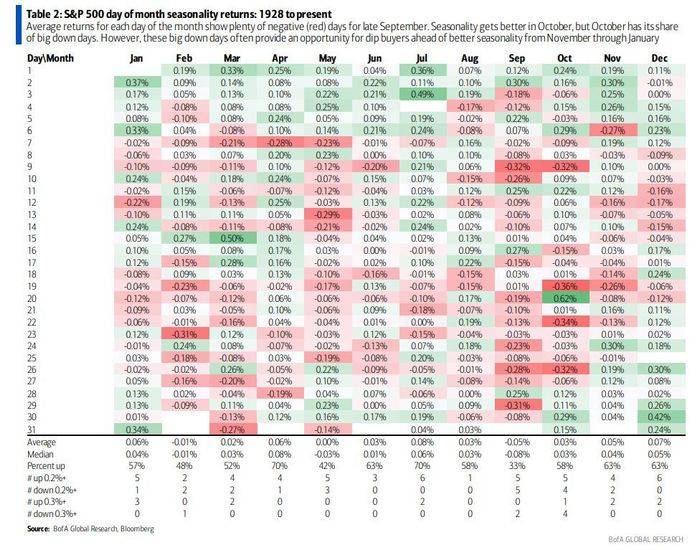
In keeping with historical trends, September has so far been a tough month for U.S. stocks.
See: What history says about September and the stock market after summer bounce runs out of steam
But as the main U.S. benchmarks are already nursing month-to-date losses of more than 2% as of Monday, there’s reason to suspect that there might be more pain ahead — especially as the Federal Reserve is expected to deliver another jumbo interest-rate hike later this week.
To wit, Bank of America
BAC,
technical research strategist Stephen Suttmeier pointed out in a recent research note that “seasonality data back to 1928 show that the last ten days of the month tend to be weaker than the first ten days of the month for every month except for December.”
What’s more: “September is the only month with negative average and media returns over the first and last ten sessions of the month.”
Suttmeier illustrated this in a chart showing that the S&P 500 has seen an average decline of more than 1% during the final ten trading days of the month.
Source: Bank of America
To offer an even more precise breakdown of historical trading patterns, Suttmeier shared a second chart showing the average return on each day of each month. The latter half of September stands out with what looks like an uninterrupted sea of red.

Source: Bank of America
In his note, the analyst also highlighted a host of other technical factors that do not bode well for stocks heading into the latter half of September. First, the declining 200-day moving average shows the S&P 500 is back in a bearish trend. And if the S&P 500 sees a meaningful break below 3,900 — which could happen if stocks close below that level again on Monday — the next support levels are much closer to the lows from mid-June.
After notching another week in the red on Friday, U.S. stocks look set to finish lower for the third session in a row on Monday, with the S&P 500
SPX,
Dow Jones Industrial Average
DJIA,
and Nasdaq Composite
COMP,
all on track to finish marginally lower.

