[ad_1]
Hedge fund performance fees, I believe, are a rip-off for clients. Few phenomena illustrate this better than “round-tripping” stocks. These are stocks that, over the course of several years, for whatever reason, see enormous price gains only to fall back to about where they started.
During the COVID-19 era, many companies have experienced such round-trip trajectories. That is not to say they were bad investments or their shares were overpriced: Stocks go up and down for reasons that are not always tied to fundamentals. But the degree to which hedge funds profit from these round trips at the expense of their investors is astounding.
Consider the performance of the online used car retailer Carvana.
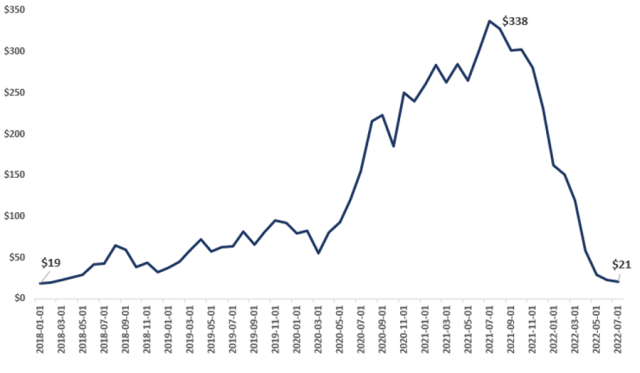
Carvana generated 87% annualized returns between 1 January 2018 and year-end 2021 (1112% cumulative returns), boosting its market cap from $2.8 billion to $40 billion across that span.
But 2022 has not been so kind. After peaking at $41 billion in 2021, Carvana’s market cap fell to $3.6 billion, with its shares down 91% for the calendar year as of 1 July. That means the stock returned a cumulative 9.7% since 1 January 2018 and has essentially “round tripped” .
Carvana’s 4.5-Year Round Trip

So, what would this mean for hedge funds and their limited partners (LPs)?
Near Carvana’s Q2 2021 peak, using data from WhaleWisdom, we estimate that hedge funds owned about 21% of the company’s stock. These include such well-respected outfits as 683 Capital, Tiger Global, D1 Capital, Lone Pine, Whale Rock, Sands Capital, and many others with excellent long-term track records.
Let’s assume that over the 4.5 years in question, hedge funds owned on average 20% of the outstanding shares of Carvana and charged a 20% annual performance fee over a 0% hurdle rate. How much would hedge funds have generated from clients by owning Carvana over the time frame? According to our calculations, they would have crystalized $1.2 billion in fees in the three years between 2018 and 2020.
This is simply stunning. Between 1 January 2018 and 1 July 2022, Carvana’s market cap went from $2.8 billion to $3.6 billion. Yet hedge funds would have crystalized 150% of that market cap gain in fees. This constitutes a pure wealth transfer from the hands of allocators into those of hedge fund managers.
| 2018 | 2019 | 2020 | 2021 | 2022 | Cum. | Current | |
| Carvana Share Price Return |
71.1% | 181.4% | 160.2% | –3.2% | –91.0% | 9.7% | |
| Carvana Market Cap, as of 1 January (Billions) |
$2.8 | $5.4 | $12.0 | $45.0 | $40.1 | $3.6 | |
| Percentage Owned by Hedge Funds |
20% | 20% | 20% | 20% | 20% | ||
| Hedge Fund Performance Fee |
20% | 20% | 20% | 20% | 20% | ||
| Implied Hedge Fund Performance Fees (Millions) |
$79 | $392 | $771 | $0 | $0 | $1,242 |
To be sure, this is only an estimate and may overstate the performance fees generated by this stock. For example, negative-returning stocks held by hedge funds mitigate the performance fees from positive-returning stocks like Carvana. Moreover, different hedge funds have various performance fee crystalization requirements, such as high-water marks, hurdles, etc. Nevertheless, ours is not an unreasonable approximation, and it actually understates the overall impact given the sheer number of stocks that have round-tripped.
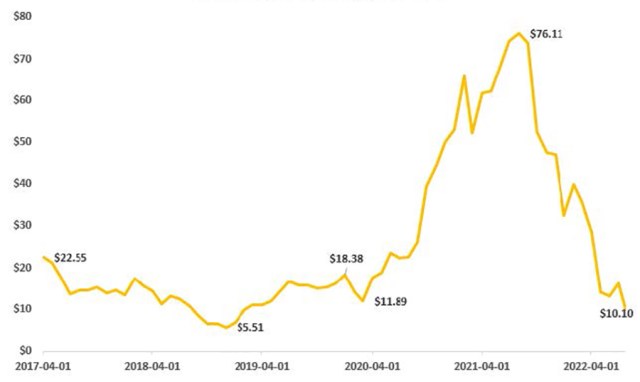
Oh Snap! Another Round-Tripper*

Indeed, Carvana’s performance is hardly an outlier. Over the last several years, shares of Facebook, Roku, Sea Limited, Shopify, Snapchat, and Zoom, among many others, have experienced similar “round trips.” The takeaway is simply that the annualized performance fees paid to hedge funds lead to absurd outcomes that always come at the expense and to the detriment of LPs.
Snap back to reality, ope there goes gravity pic.twitter.com/813RLGbgxs
— Bucco Capital (@buccocapital) July 21, 2022
Why Wouldn’t Hedge Funds Do It This Way?
Hedge fund managers are incentivized to act in their own self-interest and maximize their own wealth. They would be behaving rationally if they signed up for $1.2 billion in performance fees in exchange for delivering –5.6% in annualized net returns to clients. It’s a supremely attractive revenue stream for them, albeit an awfully poor one for their LPs.
| 2018 | 2019 | 2020 | 2021 | 2022 | Cum. | Ann. | |
| Carvana Share Price Return |
71.1% | 181.4% | 160.2% | –3.2% | –91.0% | 9.7% | 2.0% |
| Carvana as a Hedge Fund Net Return |
56.9% | 145.1% | 128.2% | –3.2% | –91.0% | –23.2% | –5.6% |
| S&P 500 TR | –4.4% | 31.5% | 18.4% | 28.7% | –19.8% | 53.6% | 9.8% |
| Carvana Hedge Fund Excess Return |
61.2% | 113.6% | 109.8% | –31.9% | –71.1% | –76.8% | –15.4% |
While extreme, our example demonstrates how performance fees can create perverse incentives for hedge fund managers. Far from better aligning their interests, allocators that insist on paying for performance may be making a bad situation worse.
With stocks like Carvana, hedge funds received a round-trip ticket over the last 4.5 years, with all expenses paid — by their LPs.
If you liked this post, don’t forget to subscribe to the Enterprising Investor.
All posts are the opinion of the author. As such, they should not be construed as investment advice, nor do the opinions expressed necessarily reflect the views of CFA Institute or the author’s employer.
Image credit: ©Getty Images/BogdanV
Professional Learning for CFA Institute Members
CFA Institute members are empowered to self-determine and self-report professional learning (PL) credits earned, including content on Enterprising Investor. Members can record credits easily using their online PL tracker.
[ad_2]
Image and article originally from blogs.cfainstitute.org. Read the original article here.


