[ad_1]
What impact does cost have on public pension fund performance?
Quite a dramatic one, it turns out.
I looked at the diversification, performance, and cost of operating large public pension funds in a recent Journal of Portfolio Management article. Among my findings:
- Large public pension funds underperformed passive investment by 1.0% per year in the decade ended 30 June 2018. The margin of underperformance closely approximates the independently derived cost of investment.
- Public pension funds are high-cost closet indexers. The vast majority will inevitably underperform in the years ahead.
Diversification and Performance
A regression of a composite of 46 large public pension fund returns on a 70-30 stock-bond benchmark is visualized in the first chart below. The benchmark affords the best fit with the composite returns and employs three indexes: the Russell 3000 (53%), MSCI ACWI ex-U.S. (17%), and Bloomberg Barclays Aggregate Bonds (30%).
Regression of Composite Public Pension Fund Returns on Factor Benchmark Returns (10 years ended 30 June 2018)
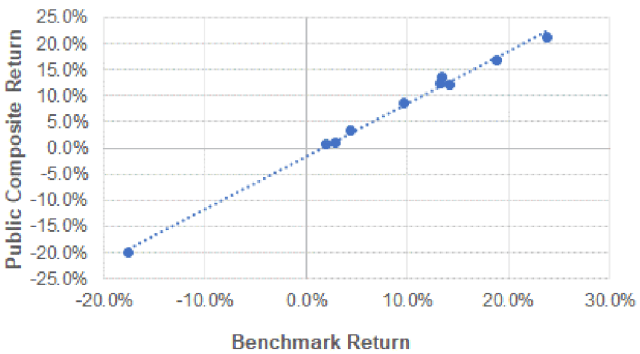
The public fund composite’s beta relative to the benchmark is 1.0, indicating market-like volatility. The intercept of the simple regression is a measure of risk-adjusted performance (alpha). The alpha of the public fund composite in the figure is -0.98% per year. The negative alpha has a standard error of 0.39% and a t-statistic of -2.5, indicating its statistical significance. The R2 of the regression is .993. The standard error of the regression (tracking error) is 1.0%, which is minuscule relative to the full range of composite outcomes of more than 40-percentage points.
The regression statistics indicate that public securities markets have become the essential drivers of pension fund returns and reveal underperformance of approximately 100 basis points (bps) per year.
Cost
I developed a rough-and-ready cost function for institutional investing that I describe in detail in the Journal of Portfolio Management article. It takes into account various elements of cost, for traditional active, passive, and alternative investments.
Working from the bottom up, I estimated the typical cost, including transaction costs, of institutional stock-and-bond–only investments at approximately 0.54% of asset value. Jeff Hooke, Carol Park, and Ken C. Yook arrived at a cost estimate of 2.48% of asset value for five public pension funds’ alternative investment portfolios using detailed accounting data. With 0.54% as the investment cost with no alternative investments and 2.48% for 100% alts, I derived a simple cost equation:
Investment cost as a percentage of asset value = 0.54% + 1.94% × A, where A is the fraction allocated to alternative investments.
The cost equation yields an estimated investment expense of 0.98% of asset value for the composite of public pension funds. (Public funds’ average allocation to alternative investments was 23% over the study period.) This happens to be the same as the observed margin of underperformance of the public fund composite. (The exact match is a coincidence. The figures were independently derived but came up identical to one another by happenstance.)
Given the 46-fund composite’s extraordinary degree of diversification — with thousands of managed portfolios and funds — we would expect it to underperform a properly constructed passive benchmark by an amount equal to the cost of operation. Hence, I equate underperformance of the composite with cost. I estimate the range of cost for the individual funds making up the composite to be approximately 0.5% to 1.5%, depending on the extent of alternative investment.
The Effect of Cost on Performance
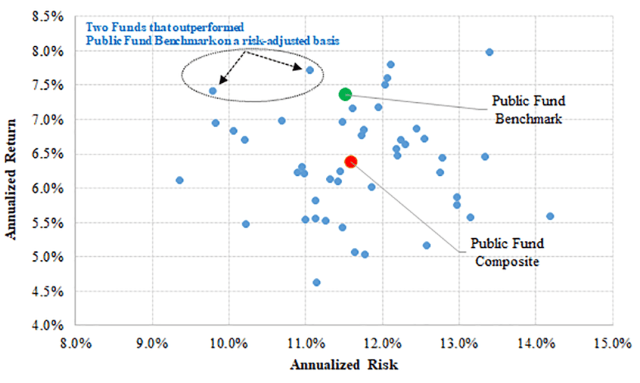
The following graphic is a risk–return performance diagram, with risk defined as annualized standard deviation of return. Each of the small blue dots represents a particular public pension fund. The red dot at the center of the cloud represents an equal-weighted average of the 46 individual funds that make up the composite. The green dot is a passively-investable benchmark for the composite, with which it shares an R2 of 99.3%. (The red and green dots are the subjects of the preceding regression diagram.)
Risk and Return (10 Years Ended 30 June 2018)
What is truly striking about the risk–return diagram? The margin of difference between the passive benchmark (green dot) and everything else.
Yes, passive implementation of the composite lies nearly 100 bps due north of the composite (red dot) as theory suggests it should: As we have seen, that is the estimated cost of active investing associated with the composite. Moreover, the no-cost passive alternative to the composite has a greater return than 40 of the 46 individual funds. And only two funds dominate the passive benchmark, with plot points falling to the left of and / or above the passive option.
In other words, just 4% of the funds, net of cost, outperformed passive investment on a risk-adjusted basis.
All of which is to say the cost of active investing had a highly detrimental effect on the performance of public pension funds, moving the funds in the second graphic in the downward direction by an estimated 0.5% to 1.5% each.
The Moral
The median R2 of the public pension funds represented here is 99% relative to passive investment alternatives. In my book, that qualifies as closet indexing and a whole lot of deadweight diversification. The cost of investing averages 1.0% with some funds paying 1.5%.
Extreme diversification combined with high cost is a recipe for failure. Here we see it in spades.
If you liked this post, don’t forget to subscribe to the Enterprising Investor.
All posts are the opinion of the author. As such, they should not be construed as investment advice, nor do the opinions expressed necessarily reflect the views of CFA Institute or the author’s employer.
Image credit: ©Getty Images / Sven Hagolani
Professional Learning for CFA Institute Members
CFA Institute members are empowered to self-determine and self-report professional learning (PL) credits earned, including content on Enterprising Investor. Members can record credits easily using their online PL tracker.
[ad_2]
Image and article originally from blogs.cfainstitute.org. Read the original article here.


