[ad_1]
Environmental, social, and governance (ESG) investing has gone mainstream in a big way over the last few years. Motivated by the desire to do well by doing good, investors have been attracted to the competitive risk–return profile of ESG strategies.
In “ESG Investing: Can You Have Your Cake and Eat It Too,” we documented ESG’s favorable risk and return performance over the last 12 years. Now, rather than accept the evidence from over the last several years as a proof statement for ESG investing, we go further and address three important questions:
- Has the recent market environment been favorable or unfavorable for ESG investors?
- Will this environment stay the same or change?
- How should ESG investors adapt to the potential changes?
Characteristics of ESG Portfolios
What differentiates ESG portfolios from their broad market benchmarks? They exhibit more positive ESG traits, obviously, but they also tend to be less value-oriented and have lower volatility.
Let’s look at some evidence. Morningstar listed a total of 12 ESG index funds that fall into its Large Blend category of funds. These funds track several different ESG indexes, but all of them invest in large- and mid-cap high-ESG stocks and attempt to control tracking error risk. Despite these efforts to rein in tracking error risk, a clear sector allocation trend emerges among these indexes because of their primary goal of providing exposure to positive ESG attributes.
The sector overweights and underweights of ESG index funds relative to a broad market benchmark are depicted in the following chart.1
ESG Sector Overweights and Underweights
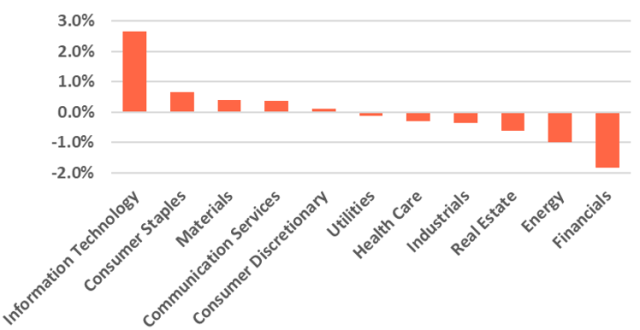
These sector allocations demonstrate a tilt towards growth-oriented technology stocks and away from value-oriented financials and energy stocks. Every ESG fund was overweight in tech and underweight in energy, and this tech-centric focus has recently generated criticism.
But what about ESG portfolios’ lower volatility, as measured by standard deviation, compared to their underlying benchmarks? The S&P 500 ESG Index’s return and volatility data is presented below. Though designed to match the S&P 500 Index’s risk and return profile, the ESG Index has generated higher returns at lower risk for periods ending 31 March 2020.
| Three-Year Return | Three-Year Volatility | Five-Year Return | Five-Year Volatility | |
| S&P 500 ESG Index | 6.18% | 14.9% | 7.33% | 13.5% |
| S&P 500 Index | 5.10% | 15.2% | 6.73% | 13.7% |
These results are consistent with our earlier study that demonstrated that High ESG portfolios had lower volatility than their Low ESG counterparts.
Recent Investing Environment
If ESG funds overweight growth-oriented and less volatile stocks, how have these stocks performed lately?
Growth has done well at the expense of value. The data below shows how much value stocks have underperformed growth stocks over the last three- and five-year periods ending 31 March 2020.
| Three Years | Five Years | |
| Russell 1000 Value Index | 9.7% | 8.29% |
| Russell 1000 Growth Index | 20.5% | 14.63% |
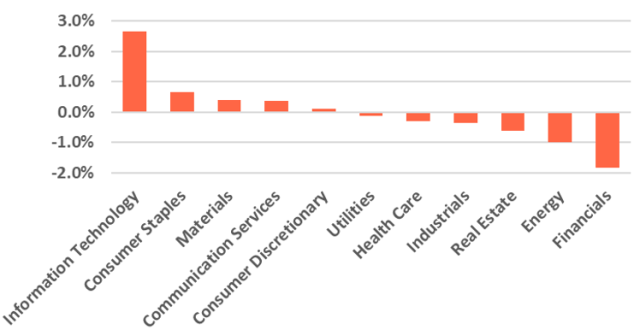
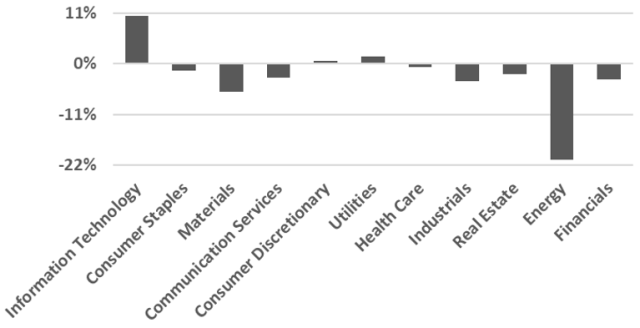
So the tilt away from value stocks has likely been a tailwind for ESG investors the last few years. What exactly does that tailwind look like? The following two charts offer an outline. The first is the sector overweight and underweight chart shown above. Below it is the relative performance of the sectors over the last five years. This juxtaposition reveals how overweighting tech and underweighting energy stocks has benefitted ESG funds.
ESG Sector Overweights and Underweights
Sector Performance Relative to Market
To evaluate the impact of the ESG funds’ second tilt — toward lower volatility — we compare the performance of Russell’s Stability Indexes. The Russell 1000 Defensive Index measures the performance of more stable Russell 1000 companies, the Russell 1000 Dynamic Index that of the less stable firms.
How did these two indexes perform over the last three- and five-year periods ending 31 March 2020?
| Three Years | Five Years | |
| Russell 1000 Defensive Index | 16.3% | 12.2% |
| Russell 1000 Dynamic Index | 13.7% | 10.7% |
These numbers suggest the tilt towards less volatile stocks has also likely been a tailwind for ESG investors.
Looking to the Future
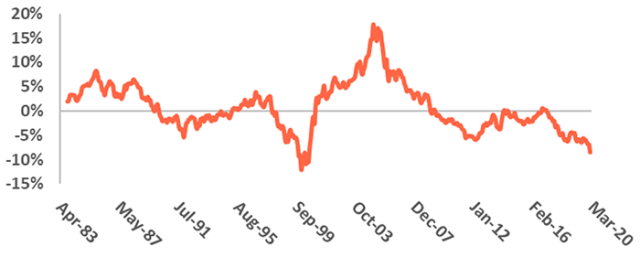
If both tilts have worked well for ESG investors in recent years, the next logical question is, What can we expect in the future? To answer that, we looked at the longer-term history of value vs. growth and defensive vs. dynamic stocks. The long-term performance of these style indices on a rolling five-year basis since their inception is presented below.
Growth over Value Stocks Performance, Rolling Five-Year Averages
Defensive over Dynamic Stocks Performance, Rolling Five-Year Averages
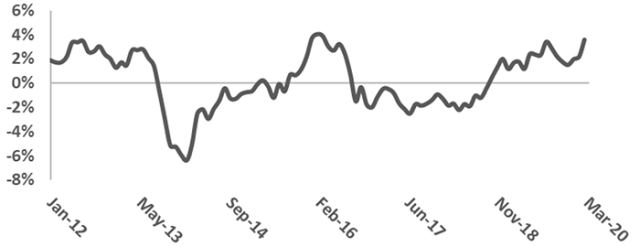
The message is clear: Value’s recent underperformance has not been the norm over the long term. And the outperformance of defensive stocks follows a cyclical pattern relative to dynamic stocks.
This data leads us to doubt that the tailwinds that have bolstered ESG investors over the last few years are secular in nature. They are cyclical. That means a reversion to the mean will turn them into headwinds.
So what is an ESG investor to do?
Indexed ESG investors have little choice but to stay within the framework created by these indices. Reversing the tilts inherent in their portfolios will be difficult.
But active ESG investors have a choice, and can act to counter the impact of the potential headwinds. The graphic below illustrates how they might accomplish that. In the first circle, the universe of stocks is divided into two equal segments, value and growth. In the second circle ,the universe of stocks is arranged into two unequal sections, Favorable and Unfavorable ESG stocks.
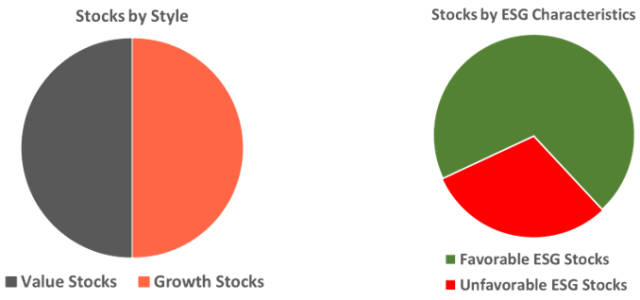
The proportion of favorable ESG stocks is larger than that of the unfavorable cohort because in practice most ESG investors — and ESG index funds — adopt the same principle. Only a minority of stocks are typically considered unacceptable from an ESG perspective.
Now, overlay the two graphs on top of one another. This produces four categories.
Stocks by Style and ESG Characteristics
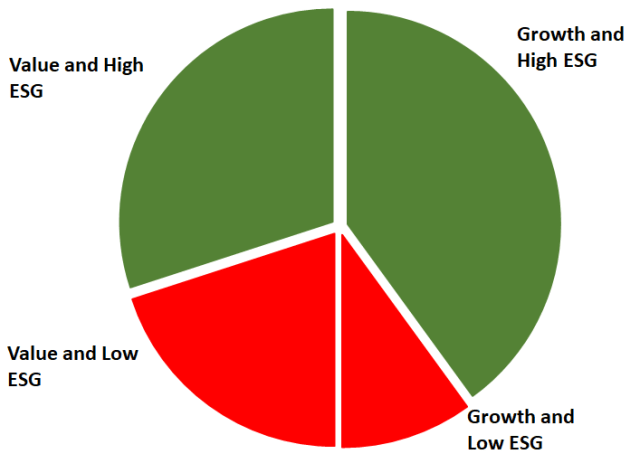
The Growth and High ESG cohort is larger than Value and High ESG. This reflects what ESG investors have found so far: Growth-oriented ESG stocks are easy to find; value-oriented ESG stocks not so much.
Looking forward, active ESG investors should keep an eye on the Value and High ESG segments. These stocks can help maintain high ESG attributes while preparing for the time when the style shifts from tailwinds to headwinds.
Investors can apply the same logic to offset the potential negative impact of holding defensive stocks too long. Simply look for less-defensive stocks with positive ESG attributes.
Conclusion
ESG’s natural tendency to tilt toward growth and high quality should give thoughtful ESG investors pause. If the recent tailwinds are to reverse, logically we should be looking for ESG gems in two categories: value and less defensive.
1. The Russell 1000 Index is used here as the benchmark that is representative of large- and mid-cap US stocks. Sector allocation was obtained from the 31 December 2019 fact sheets published by each fund on its website. Two of the funds did not use GICS sector classifications and could not be included in this graphic; however, both funds did show an overweight to technology stocks and underweight to energy stock.
If you liked this post, don’t forget to subscribe to the Enterprising Investor.
All posts are the opinion of the author. As such, they should not be construed as investment advice, nor do the opinions expressed necessarily reflect the views of CFA Institute or the author’s employer.
Image credit: ©Getty Images / Pavliha
Professional Learning for CFA Institute Members
CFA Institute members are empowered to self-determine and self-report professional learning (PL) credits earned, including content on Enterprising Investor. Members can record credits easily using their online PL tracker.
[ad_2]
Image and article originally from blogs.cfainstitute.org. Read the original article here.

