[ad_1]
Analyses of gold and silver often tend to focus on demand-side drivers, with relatively minor attention given to the influence of supply. For example, both metals display negative correlations to changes in expectations for U.S. short-term interest rates and the U.S. dollar (Figures 1 and 2). While demand drivers such as these are important short-term determinants of prices, mining supply can be a significant driver of prices over the longer term.
Figure 1: Precious metals typically react negatively to expectations of higher Fed rates
Figure 2: Gold typically reacts negatively to a stronger U.S. dollar


Scan the above QR code for more expert analysis of market events and trends driving opportunities today!
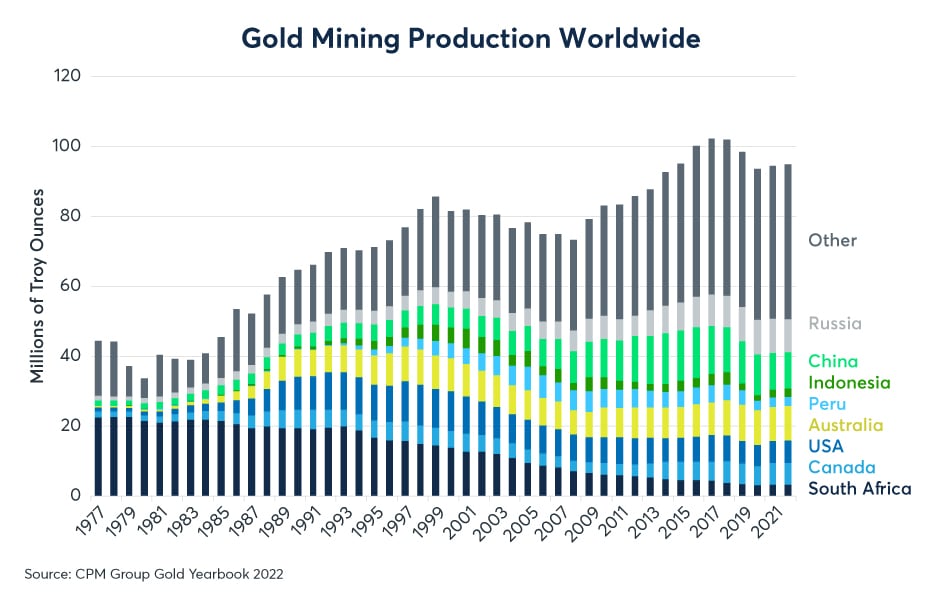
In recent years mining supply of gold and silver has been on a downward trend. Gold mining supply fell 7% between 2016 and 2021, from 102.2 million troy ounces to 94.4 million (Figure 3). Silver mining supply has fallen even more sharply, declining 8.5% between 2016 and 2021, going from 826.7 million troy ounces to 756.4 million (Figure 4). This may be part of the reason why gold and silver prices have been supported in recent years.
Figure 3: Gold mining production has fallen 7% since 2016

Figure 4: Silver mining production fell by 8.5% since 2016

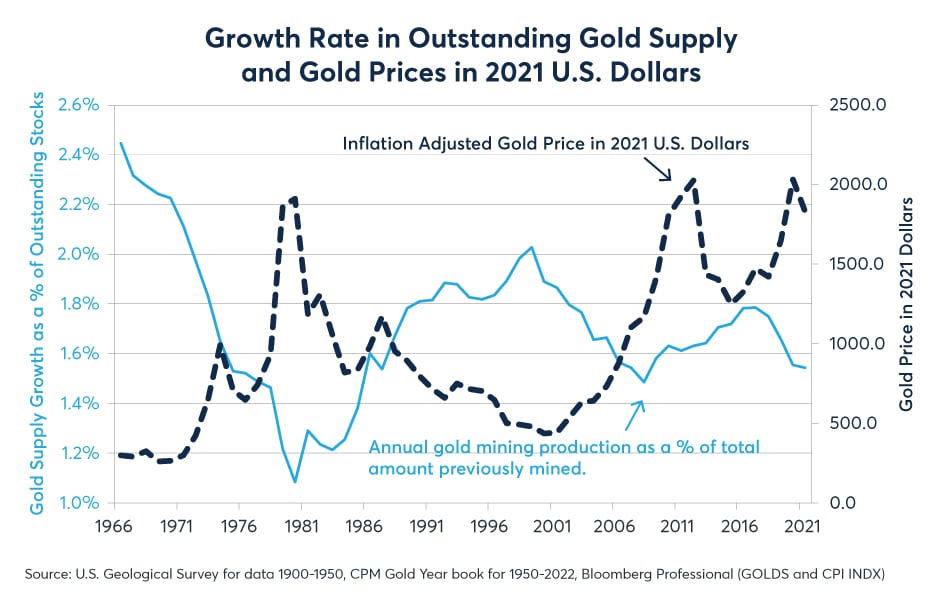
Mining supply appears to have a strong impact on precious metals prices over time. There appears to be a strong inverse relationship between the annual growth rate in the total amount of gold supply (current year production divided by cumulative supply from previous years), and the real price of gold expressed in 2021 U.S. dollars (Figure 5). Looking at the data, one notices the following:
- 1965-1980: gold production plunged from a 2.4% growth rate in total supply during the mid-1960s to a 1.1% growth rate by 1980. During this time gold prices soared from $35 per ounce to $800 in nominal terms.
- 1981-1998 gold production boomed, recovering from a 1.1% annual growth rate of annual supply in the early 1980s to over a 2% annual pace of increase by the late 1990s. During this period gold prices retreated sharply from their highs, falling from over $800 per ounce in 1980s to as low as $280.
- 1998-2009: Golding mining output contracted again from a 2.1% to a 1.5% pace of expansion in total supply, which presaged a gold bull market that lasted from 2002 to 2011, taking gold from $280 per ounce to nearly $2,000.
- 2009-2016: gold mining output began to grow again, expanding annual supply growth from 1.5% to 1.8% of the previously mined cumulative total. After peaking in 2011, gold prices fell sharply from nearly $2,000 per ounce to below $1,300.
- 2016-2020: In recent years gold prices have recovered towards and even slightly exceeded their 2011 highs as gold mining production has contracted back to a growth rate close to 1.5% per annum.
Figure 5: Inflation-adjusted gold prices vary inversely with growth in gold mining supply

Movements in gold and silver prices are more often attributed exclusively to demand-side factors. For example, during the period from 1965 to 1980, the U.S. dollar fell in value versus foreign currencies as inflation soared and the Federal Reserve (Fed) often held interest rates at negative levels in real terms. Precious metals prices soared. During the 1980s and 1990s, the opposite occurred: the Fed maintained positive real rates and inflation subsided, and gold and silver prices fell. Gold and silver advanced from 2002 to 2011 amid periods in which the Fed slashed rates, first to 1% in 2002 and 2003, and later to zero from 2009 to 2015. Our analysis suggests, however, that demand-side and supply-side factors combined to produce the decades-long bull and bear market and that neither side of the demand-supply equation was solely responsible for gold and silvers’ price movements.
What is interesting is this: not only does gold react negatively to an increase in gold mining supply but it also reacts negatively to a change in the silver mining supply. For silver the results are even more interesting: silver reacts even more negatively to an increase in gold mining supply than it does to a change in silver mining supplies (Figure 6).
Figure 6: Gold and Silver Are Negatively Sensitive to Changes in Each Other’s Mining Production

According to the regression results, between 1977 and 2021, a 1% log increase in gold mining supplies produced (on average) a 2.15% log decrease in the price of gold and a 3.06% log decrease in the price of silver. Meanwhile, a 1% log increase in the mining production of silver led to (on average) a 1.88% log decline in the price of gold and a 1.72% log decrease in the price of silver. Moreover, the regression results are quite strong from a statistical perspective: changes in the mining supply of gold and silver explain 52% of the year-on-year change in the price of gold and 47% of the year-on-year change in the price of silver. The likelihood of obtaining such strong results randomly are extremely low with “p-values” close to zero except in the case of silver supply’s impact upon silver (Table 1).
Table 1:

But what will happen to gold and silver supply in the future? For the moment mining remains an extremely profitable activity. Even with gold prices down to $1730 at the time of this writing, those prices remain far above the gold’s cost of production. Metals Focus’s Gold Focus 2022 estimates the cash cost of producing gold at $768 per troy ounce and the all-in sustaining cost at $1,068 (Figure 7). This suggests profit margins north of 60% for the world’s gold mine operators, on average, and operating margins well over 125%.
Figure 7: Gold prices far exceed all in sustaining costs of running mines

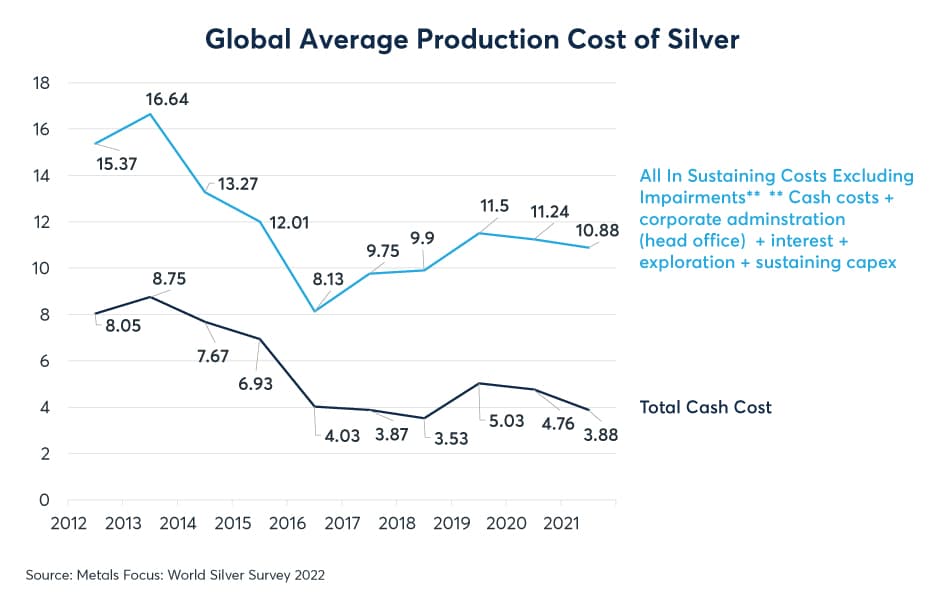
Similarly, Metals Focus’s World Silver Survey 2022 estimates silver’s total cash cost of production at $3.88 per ounce, and all-in sustaining cost of silver production at $10.88 per ounce (Figure 8). With silver recently trading near $19 per ounce, silver production remains highly profitable with net profit margins from mines around 75%.
Figure 8: Silver mining costs are far below the current price close to $19 per troy ounce

As such, there is no particular reason to expect that miners would cut back on production for economic reasons alone. Even if one adds 25% to the cost of production to take into account the capital expenditure (capex) of developing futures mines, there appears to still be a strong case for investment. That said, there may be environmental and political reasons to defer investing in the sector, and high current profit margins do not necessarily imply that we will see strong growth in the sector in the near future. Finally, even amid increased investment there may not be a strong rebound in silver and gold production for many years given the time required to begin extracting ore from new mines. Thus, while there is little reason to anticipate cutbacks at the world’s mines, there is equally little reason to believe that today’s high prices will quickly translate into increased production of either metal.
This post contains sponsored advertising content. This content is for informational purposes only and not intended to be investing advice.
This article was submitted by an external contributor and may not represent the views and opinions of Benzinga.
[ad_2]
Image and article originally from www.benzinga.com. Read the original article here.

