[ad_1]
Gold is perhaps the world’s oldest store of value still in widespread use. Yet it is impossible to determine its intrinsic value. Why? Since gold doesn’t generate any income, it has no cash-flow stream to discount. In this respect, it is similar to sovereign debt in developed countries today. And just as gold was used to create money in earlier eras, sovereign debt serves the same purpose today.
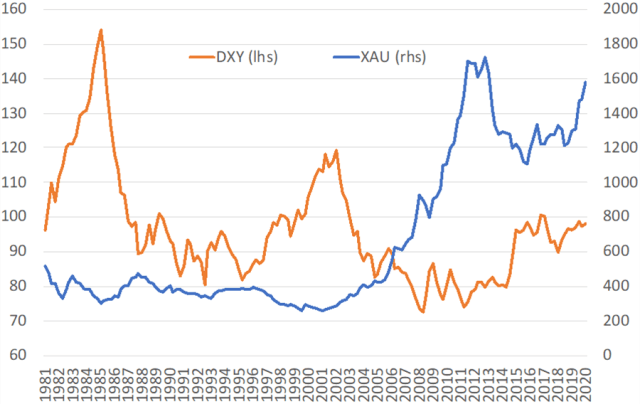
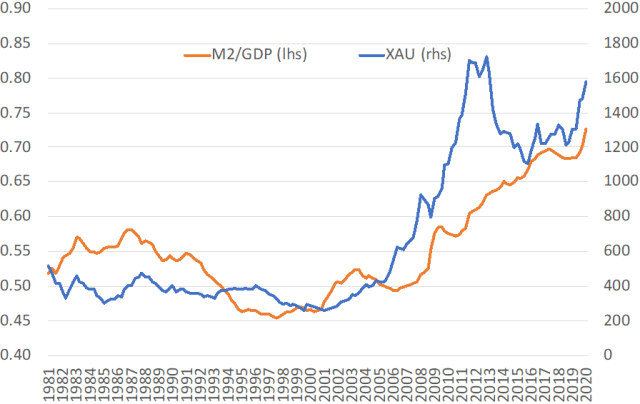
The price of gold (XAU) and the US dollar index (DXY) tend to have a negative correlation while the price of gold and the money supply (M2/GDP) have a positive one. This largely held true from 2000 to 2020 and reflects how US dollars and gold have served as central banks’ official reserves and how in the Bretton Woods system, gold was denominated in US dollars.
When US monetary policy loosens and the return on risk-free dollar assets falls, the DXY tends to decline too while M2/GDP rises, causing the XAU to increase. The ongoing rally in gold prices is consistent with the rapid growth in the US money supply following the resumption of quantitative easing (QE) in response to the COVID-19 shock. But XAU and DXY’s negative correlation seems to have all but disappeared.
Why has this happened and what else may be in store for gold? Before we can answer that, we need to better understand the historical context.
Gold Prices (XAU) and the Dollar Index (DXY)
Gold Prices (XAU) and the US Money Stock (M2/GDP)
The Decade-Long Gold Bull Run, 2000–2011
The price of gold reached its nadir in the aftermath of the dot-com bubble and thereafter began an 11-year rally. On a high-frequency basis, the price of gold price tends to rise with geopolitical crises, jumping more than 5% on 11 September 2001 and ~5% on 24 June 2016, the day after the Brexit referendum.
Such events can have longer-term repercussions for gold prices. In response to the 2001 terrorist attacks, for example, the United States went to war in Afghanistan and Iraq. And from a budget surplus to fiscal deficits on top of a massive trade deficit. This prompted a prolonged US dollar bear market that ended only when the global financial crisis (GFC) ground the financial system to a halt.
The GFC represented the mother of all liquidity crises and banks desperately sought much-needed dollars. In just a matter of months, the euro peaked vs. the dollar and then commenced one of the largest drawdowns in its history. Margin calls had to be met, and gold prices plunged amid a frenzy of forced selling.
But then the US Federal Reserve stepped in to stabilize the markets, providing unprecedented dollar liquidity via QE. Forced selling ceased and gold prices spiked again. It took the European debt crisis to finally put an end to the metal’s decade-long bull run.
Gold’s Downward Correction Phase, 2011–2015
Early in the European debt crisis, concerns about a potential euro crack-up and US debt ceiling negotiations increased demand for gold. The XAU crested in September 2011 just as the DXY bottomed out and started a prolonged upswing. With Greece on the brink of default and the euro’s future at risk, some liquidity-conscious European banks may have sold down their gold reserves in exchange for dollars.
Meanwhile, the US economy steamed ahead en route to full employment. which increased demand for US-denominated assets. The DXY spiked again following the 2014 oil crash and gold prices slumped. When Europe finally came to Greece’s rescue in 2015, liquidity concerns eased, the DXY reached a plateau, and gold prices began to recover.
The Second Bull Run, 2015–2020
Since hitting bottom in late 2015, gold has been on the rise, with no end in sight. As Europe has moved gradually towards more of a fiscal union, as we predicted, and the United States has struggled with its response to the COVID-19 pandemic and social and political unrest, the DXY has only fallen slightly. This despite accelerated US monetary expansion in the face of the pandemic. With no negative correlation between gold and the money supply, the current gold rally is different.
So what does it mean? In our view, the European Central Bank (ECB)’s embrace of QE has distorted the negative relationship between XAU and DXY. It boosted both gold and the dollar: EUR/USD traded broadly around the 1.10 level over the past five years compared with 1.20-1.50 over the five years before that. In 2015, the ECB shifted from a conservative monetary policy based on German Bundesbank traditions to a looser, more Fed-like approach.
With the two largest central banks printing so much money to combat the COVID-19 crisis, the dollar and euro should have lost value against gold. But the gold rally — and the elevated unease among investors that it represents — preceded the pandemic. After all, gold and the DXY jumped dramatically following the Brexit referendum based on fears the post-World War II global political and financial order could be cracking.
The continued rise of populist movements throughout the globe validates this fear and may hint at a reshuffling. Globalization in many areas looks to be shifting into reverse. With already-strained geopolitical and financial structures further stressed by the pandemic, soaring gold prices may signal trouble ahead.
Where Do We Go from Here?
The inverse relationship between gold and the dollar should hold firm in the long run. For example, real and potential liquidity crises (GFC) tend to cause gold prices to fall as banks and investors convert the metal into cash. But then the central banks step in and flood the system with liquidity and prices recover.
A similar mechanism is at work with the pandemic. As the ECB and the Fed injected money into the economy, the DXY had stayed relatively flat until fairly recently. (There has been a marked decline since we conducted this analysis). So whatever happens, the dollar will move based on the relative strength of European and US economy and policy frameworks. At times like these when monetary and fiscal policy have never been looser, gold may continue to climb to new heights.
Three Scenarios
So what might this mean for the price of gold? To find out, we applied simple econometrics to estimate a quarterly “error-correction” model for the price of gold as a function of its main fundamentals: DXY and M2/GDP in the United States.
The long-term equation, which is estimated from the first quarter of 1981 to the first quarter of 2020 and constitutes 160 observations, is presented below. Following convention, we deflated the gold price by the CPI; t-statistics in are parentheses.

The unexplained residual is the degree of over- or undershooting. With all variables converted into logs, the coefficients can be interpreted as elasticities. So according to this estimation result, the impact of a 1% DXY increase on XAU/CPI equals -0.67% and that of a 1% increase in the money stock ratio to GDP equals 2.77%.
There are several points to keep in mind before using this model for forecasting purposes. Since the correlation equals 72%, the model does not explain more than 25% of the variation of the (deflated) price of gold. This is partly because the dynamic effects inherent in the evolution of asset prices are omitted: for example, a “momentum” effect, when the price of gold moves because it has moved that way in the past; or an “error correction” effect, when the price moves because it has over- or undershot the fundamentals. To remedy this, a short-term equation can be added to the model to explain the change in price by its own one quarter-lag, the momentum effect, and to the one-quarter lagged unexplained residual of the long-term equation, the “error correction mechanism,” or the lagged residual of the long-term equation above ECMt-1:

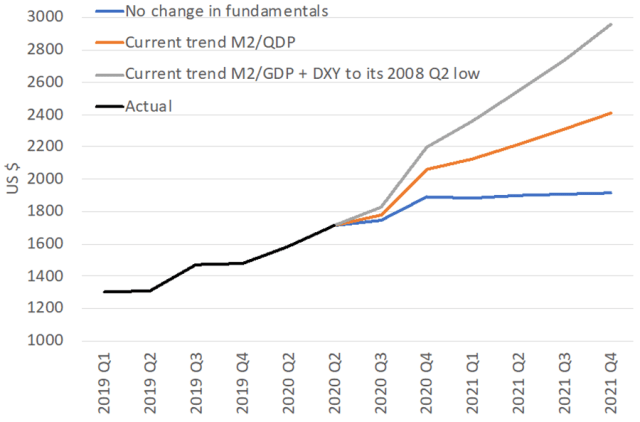
From this model, we constructed three scenarios for the price of gold through the final quarter of 2021 based on projections for the fundamentals. Although the model predicts the deflated price of gold, we can anticipate the implied nominal price via a projection for the CPI, which we anticipate will increase by 2% annually.
Three Scenarios for the Price of Gold
1. No Change in Fundamentals
This scenario assumes that M2/GDP and DXY remain at their last observed quarterly level. So the price of gold would rise slightly to ~$1,900 and stabilize there in 2021. This is likely a low-probability outcome if, as expected, QE-fueled monetary growth continues.
2. Continued Monetary Expansion
The money supply to GDP ratio has generally increased by approximately 1 percentage point per quarter through 2019 and early 2020. If this trend holds into 2021, leaving everything else unchanged, gold could reach $2,400 by the final quarter of 2021. This seems the much more likely scenario and may, in fact, be relatively conservative. If anything, money creation will only accelerate.
3. A Weaker Dollar
The DXY has strengthened somewhat since early 2019. More recently, as the ECB relaunched QE in response to the pandemic, the euro has weakened against the dollar. But depending on how the pandemic plays out, the DXY’s upward trend may reverse. By the fourth quarter of 2021, it could even approach its 2008 low. Our calculations, which assume continued QE, suggest that a price of $3,000 per ounce is possible.
All in all, this constitutes a bullish outlook for the price of gold. We see little in the way of downside risk and anticipate gold will fall within a bandwidth of $1,900 and $3,000 over the next 18 months.
Which means the one of the world’s oldest stores of value may be storing more of it in the months ahead.
If you liked this post, don’t forget to subscribe to the Enterprising Investor.
The views, opinions, and assumptions expressed in this paper are solely those of the authors and do not reflect the official policy or views of JLP, its subsidiaries, or affiliates.
All posts are the opinion of the author. As such, they should not be construed as investment advice, nor do the opinions expressed necessarily reflect the views of CFA Institute or the author’s employer.
Image credit: ©Getty Images / Bloomberg Creative
[ad_2]
Image and article originally from blogs.cfainstitute.org. Read the original article here.

