[ad_1]
The Global Pension Funds Crisis
Then, in October, the two largest Dutch pensions funds, ABP and PFZW, warned that their funding ratios were too low and that they would have to cut pension benefits for millions of retirees. This triggered tense discussions between the pension funds, an alarmed government, and enraged trade unions.
Yet the Dutch pension system is among the best-managed in the world, and both ABP and PFZW are in enviable positions with funding ratios of approximately 90%. Other countries have it much worse. The situation in some US states is particularly grim: The public pensions of Kentucky, New Jersey, and Illinois, for example, all have funding ratios below 40% and are effectively irreparable.
To make matters worse, the current return assumption for the average US public pension fund is 7.25%, according to the National Association of State Retirement Administrators (NASRA). Such a figure is overly optimistic in a low interest rate environment. And if the return expectations are unrealistic, that means the liabilities and funding deficits are even larger.
So what is the true outlook for returns from US equities and bonds based on historical data? And what needs to happen to achieve the 7.25% return assumption?
The Life and Death of the 60/40 Portfolio
A traditional equity/bond portfolio, commonly called the 60/40 portfolio based on its allocations, has served US investors well over the last few decades. But those salad days, with their secular bull markets in both stocks and bonds, are likely coming to an end.
It’s not hard to see why.
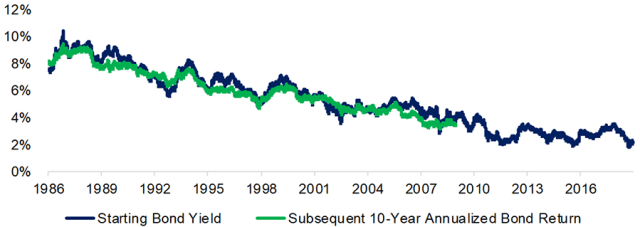
Bonds have declined consistently since the 1980s and generated attractive returns for investors. But the bond yield at the time of purchase — the starting bond yield — largely determines the nominal total return over the next decade. So what you see is what you get.
With current bond yields at approximately 2%, the fixed-income portion of the portfolio is unlikely to generate the type of returns that it has in the past.
US Bond Returns vs. US Starting Bond Yields
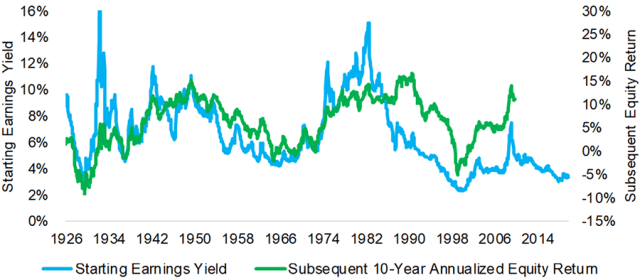
The relationship between valuation and subsequent returns is not as statistically meaningful for equities as it is for fixed income. Stocks only have a 0.55 correlation compared with 0.97 for bonds. Nevertheless, historically the lower the earnings yield — calculated as the inverse of the cyclically adjusted price-to-earnings ratio (CAPE) — at the time of the investment, the lower* the subsequent returns.
But as emerging economies become more technologically driven and different accounting standards are adopted, older valuation data may lose some of its relevance. While slightly higher valuations may be justified, these still mean-revert over time.
The current earnings yield of 3.3% equates to a CAPE ratio of 30, which is expensive even in light of recent history, and suggests low returns for US equities over the next 10 years.
US Equity Returns vs. US Starting Earning Yields
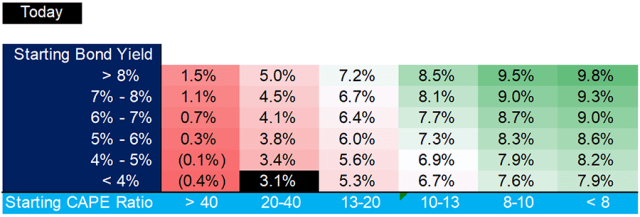
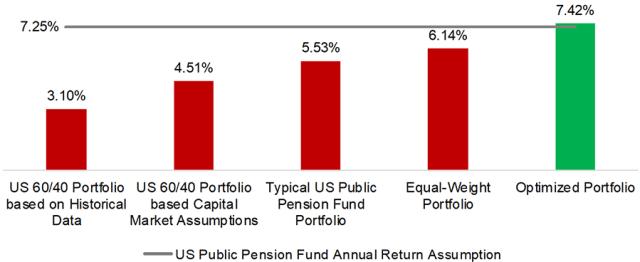
By combining the expected returns from equities and bonds based on historical data, we can create a return matrix for a traditional 60/40 portfolio. Our model anticipates an annualized return of 3.1% for the next 10 years. That is well below the 7.25% assumed rate of return and is awful news for US public pension funds.
Subsequent 10-Year Annualized Return for Traditional 60/40 Equity/Bond Portfolio
Alternatives to the Rescue?
If US equities can’t deliver the required returns, where can pension funds go? With low or negative interest rate environments in much of the developed world, international bonds aren’t especially appealing. So what about international and emerging market equities, real estate, hedge funds, and private equity?
Large asset managers provide 10-year return assumptions for various asset classes. We aggregated this data from a number of firms and found that almost every asset class is expected to outperform US equities and bonds.
Of course, these expected returns should be treated with severe caution for several reasons:
- Forecasted asset prices are highly unreliable.
- Asset managers often have conflicts when creating forecasts since they market products for the various asset classes. That’s why it is so rare to see negative return forecasts.
- Forecasts for alternatives are derived from data-bias-prone indices that tend to overstate returns.
Asset Manager Capital Market Assumptions: Expected Annualized Returns, 2019
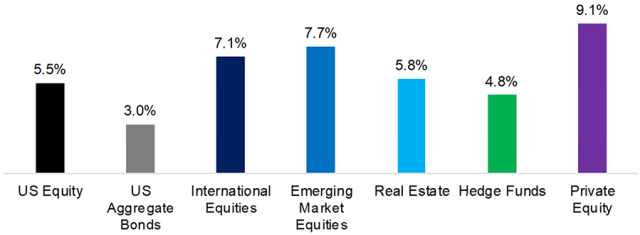
Though unreliable, capital market assumptions are one of the only games in town. There are few alternative methodologies for portfolio construction. In addition to return estimates, some asset managers also forecast volatility and correlations. These tend to demonstrate that given their low correlations with equities, such alternatives as real estate, hedge funds, and private equity offer diversification benefits. But that conclusion is a bit misleading: The low correlations can also be attributed to smoothed valuations and a lack of daily mark-to-market accounting.
Because of this, we ignored the interaction among asset classes and created four simple portfolios composed of seven major asset classes: US equities, US bonds, international stocks, emerging market stocks, real estate, hedge funds, and private equity.
- US 60/40 Portfolio: A traditional equity/bond portfolio, one based on historical data and another on capital market assumptions.
- Typical US Public Pension Fund Portfolio: 50% equities, 22% fixed income, 7% real estate, and 19% alternatives, according to NASRA.
- Equal-Weight Portfolio: Allocates equally among the seven asset classes.
- Optimized Portfolio: Allocates to meet or exceed the 7.25% return assumption of US public pension funds with a 25% maximum allocation per asset class.
Our results are bad news for public pension funds: Except for the Optimized Portfolio, all our models failed to hit the 7.25% mark.
The Optimized Portfolio exclusively allocates to international and emerging stocks, real estate, and private equity. It has zero exposure to US equities or bonds. Most investors would consider this extreme and risky, although it is slightly reminiscent of the current allocation of Yale University’s endowment fund.
Asset Allocation Models and Expected Annualized Returns, 2019
Further Thoughts
Pension funds need to reduce costs. They can accomplish this, in part, by fully embracing passive management and low-cost alternatives. But that won’t be enough to meet their goals.
Governments will have to increase the retirement age, and by a significant margin, to reduce liabilities. But given the poor return outlook, that likely won’t be sufficient either.
And that means pension benefits have to be cut. And that will likely spur more protests.
With inequality already tearing at the fabric of society, reducing benefits to the elderly has the potential to rip it apart.
So demonstrations like those in the Netherlands earlier this year may turn out to be the initial raindrops of a much larger storm.
* The text initially read “the higher the subsequent returns.” That was an error and has been corrected.
For more insights from Nicolas Rabener and the FactorResearch team, sign up for their email newsletter.
If you liked this post, don’t forget to subscribe to the Enterprising Investor.
All posts are the opinion of the author. As such, they should not be construed as investment advice, nor do the opinions expressed necessarily reflect the views of CFA Institute or the author’s employer.
Image credit: ©Getty Images/Ed Scott
Professional Learning for CFA Institute Members
CFA Institute members are empowered to self-determine and self-report professional learning (PL) credits earned, including content on Enterprising Investor. Members can record credits easily using their online PL tracker.
[ad_2]
Image and article originally from blogs.cfainstitute.org. Read the original article here.

