[ad_1]
Introduction
Diversify, reduce fees, avoid active trading, and keep it simple.
Most investors would be well-served by following the above framework. But while easy to recommend, this rubric is rather difficult to implement.
For example, how does an investor diversify in 2021? Over the last 40 years, a simple equity and bond portfolio did a fabulous job generating attractive risk-adjusted returns. Not much was needed beyond these two asset classes. But with bond yields declining, fixed-income instruments have lost much of their luster. There are potential replacements — hedge fund strategies, for example — but these can be complex and expensive.
Indeed, other, even simpler asset allocation questions also lack easy answers. Consider the basic equity allocation. As per the framework, diversification, both across and within asset classes, is critical. For US-based investors, this means exposure to international and emerging markets. But what allocation formula should they apply? Market-cap or equal-weighted? Perhaps factor-based?
The same question holds within US equity allocations. How should they be weighted? The largest investors often have little choice. Given their liquidity requirements, they must pursue market-cap weighting. Smaller, more nimble investors, however, can allocate more to less liquid stocks.
Researchers have long compared the performance of equal- and market cap-weighted equity strategies, but no clear consensus has emerged on which is preferable. In the last two stock market crashes, during the global financial crisis (GFC) in the late aughts and the COVID-19 pandemic last year, a market cap-weighted portfolio outperformed in the US stock market.
But two data points are hardly statistically meaningful. So what about earlier downturns? How have equal- and market cap-weightings in US equities fared during previous stock market crashes?
Performance Aspects
A comparison of US stock market decile portfolios makes the case for equal-weighting. The smallest 10% of stocks did much better than the largest 10%, according to data from the Kenneth R. French Data Library. Since this represents the size factor, those familiar with factor investing would hardly find this outcome surprising.
CAGRs per Market-Cap Decile in the US Stock Market, 1926 to 2021
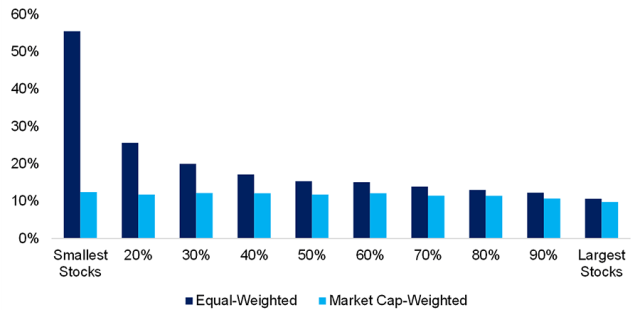
Though small-cap performance is enticing over the 90 years since 1926, the excess returns were mostly generated before 1981, when Rolf W. Banz published his seminal paper on small-cap stocks. Since then, small-cap performance has been rather lackluster, so there is far less enthusiasm for the size factor among investors today than in the past.
Furthermore, these historical returns are back-tested rather than realized. And the smallest 10% of stocks have tiny market capitalizations and are not liquid enough for most investors. The theoretical returns of the size factor would be significantly lower if transaction costs were included.
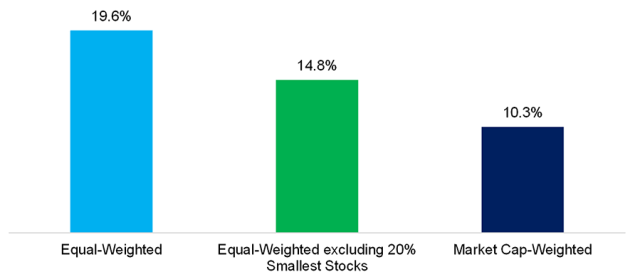
Since our focus is practical financial research, we will exclude the bottom 20% of the smallest stocks from our analysis. This decreases the returns of an equal-weight strategy, but also makes them more realistic.
US Stock Market CAGRs, 1926 to 2021
Stock Market Crashes: Equal vs. Market-Cap Weighted
Of the 18 worst stock market crashes between 1926 to 2021, some, like the 1987 plunge, were short in duration, while others were long bear markets that extended for well over a year. These market declines were driven by diverse causes, from wars and geopolitical strife to economic recessions, bubbles, and a pandemic.
Broadly speaking, the drawdowns of our new equal-weighted portfolio and its market cap-weighted counterpart were similar. However, in five cases — in 1932, 1933, 1942, 1978, and 2002 — they diverged by 10% or more. In each instance, the equal-weighted portfolio had smaller drawdowns.
Stock Market Crashes: Equal- vs. Market Cap-Weighted Portfolios
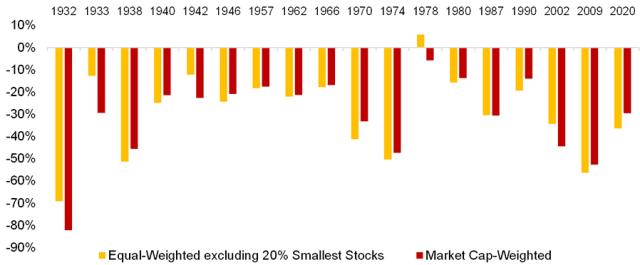
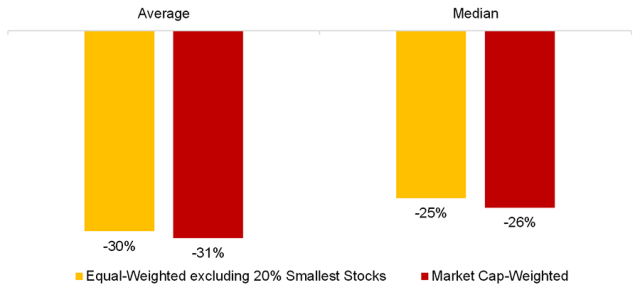
Based on the above chart, investors might assume that equal-weighted portfolios did better during stock market downturns in general, but the average and median across the 90-year period were almost identical.
Although the risk is similar when comparing the drawdowns, smaller companies tend to be a bit more volatile than their larger peers. As such the equal-weighted portfolio had slightly higher volatility, 16% to the market cap-weighted portfolio’s 15%.
Stock Market Crashes, 1932 to 2021: Equal vs. Market Cap-Weighted Portfolios
Further Thoughts
Beyond the risk considerations, two other factors must be taken into account when evaluating equal versus market cap-weighted indices.
First, buying a cap-weighted index implies negative exposure to the size and value factors and positive exposure to the momentum factor. These exposures may not always be significant, but if there’s a repeat of the tech bubble implosion of 2000, they will matter.
Second, based on their liquidity requirements, most large institutional investors have no alternative but to adopt cap-weighted strategies. Investing billions in small caps or emerging markets is more expensive than trading large-cap US stocks. Equal-weighting may offer higher returns for equity investors over the long run, but the majority of capital may not be able to access them.
For more insights from Nicolas Rabener and the FactorResearch team, sign up for their email newsletter.
If you liked this post, don’t forget to subscribe to the Enterprising Investor.
All posts are the opinion of the author. As such, they should not be construed as investment advice, nor do the opinions expressed necessarily reflect the views of CFA Institute or the author’s employer.
Image credit: ©Getty Images / Witthaya Prasongsin
Professional Learning for CFA Institute Members
CFA Institute members are empowered to self-determine and self-report professional learning (PL) credits earned, including content on Enterprising Investor. Members can record credits easily using their online PL tracker.
[ad_2]
Image and article originally from blogs.cfainstitute.org. Read the original article here.


