

[ad_1]
US Stocks continued their downward slide in Q3 of 2022, marking three consecutive quarters in the red for all three major equity indices. The Dow Jones Industrial Average fell the hardest with a 6.17% decline in the third quarter, followed closely by the S&P 500 and Nasdaq Composite.
Download Visual | Modify in YCharts
Below is a sneak peek of insights from the YCharts Q3 2022 Economic Summary Deck. The deck, published quarterly, arms advisors and investors with key insights from the previous quarter to help you make smarter investment decisions going forward. The deck is also easily customizable with your own firm branding to be leveraged in client communications.
You can also join YCharts on Wednesday, November 2nd for a live review of the full Q3 Economic Summary Deck. Click Here to save your seat!
Asset Class Performance
The table below shows the performance of asset classes over increasingly longer lookback periods.
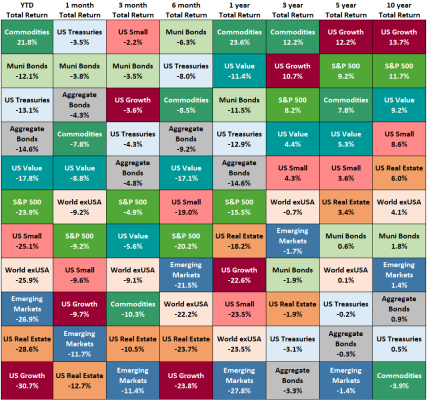
Click to Download Asset Class Performance Table
US Small Cap was the relative outperformer in Q3 2022 despite falling 2.2% in Q3. Meanwhile, Commodities are still leading year-to-date even after posting a -10.3% return in Q3. Emerging Markets took the biggest tumble in Q3 2022, down 11.4% over the quarter for a YTD decline of nearly 27%.
Easing Oil & Gas Prices
WTI & Brent Crude Oil hit highs in early 2022, causing drivers to feel the pinch at the pump. However, Q3 reversed those gains with each spot price decreasing by more than 25% and retail gas prices tracking accordingly.
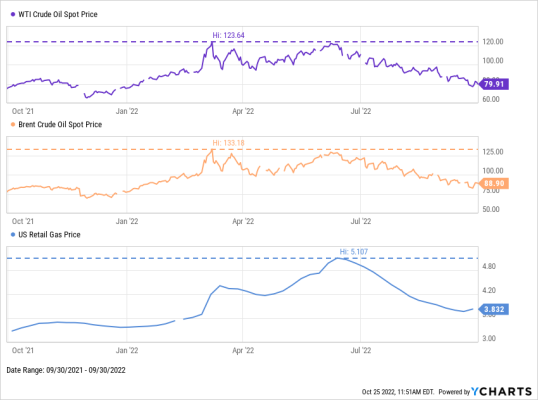
Download Visual | Modify in YCharts
Inflation Adjusted Earnings
On a relatively positive note, Inflation rates haven’t increased this quarter, but year-over-year figures remain high. The Inflation Rate was 8.2% as of September, and Core Inflation logged a ten-year high of 6.63%.
Wage growth, illustrated by US Average Hourly Earnings, has for the most part consistently set all-time highs. However, bigger paychecks don’t necessarily translate to greater purchasing power as other inflation inputs have risen faster, resulting in Real Average Hourly Earnings that are now below pre-COVID levels.
This article was originally published on YCharts.
The views and opinions expressed herein are the views and opinions of the author and do not necessarily reflect those of Nasdaq, Inc.
[ad_2]
Image and article originally from www.nasdaq.com. Read the original article here.