[ad_1]
On-chain data shows Bitcoin is closing in on a crossover that has historically proved to be bullish for the price of the crypto.
Bitcoin Short-Term And Long-Term UTXO Age Bands Approach Crossover
As pointed out by an analyst in a CryptoQuant post, BTC has usually observed a significant rise following the formation of such a crossover.
The relevant indicator here is the “UTXO Age Bands,” which tells us the percentage of the Bitcoin supply that each group is holding right now.
The different Age Bands denote the time period between which each UTXO (or simply, each coin) falling into said band was last moved.
For example, the 6m-12m UTXO Age Band includes the part of the BTC supply that hasn’t been transferred since six to twelve months ago.
In the context of the current topic, the Age Bands of interest are the 1m-3m and the 2y-3y groups. The first of these represents the short-term UTXOs (as they haven’t aged much yet), while the latter denotes the long-term UTXOs.
Now, here is a chart that shows the trend in both these Bitcoin UTXO Age Bands in the last several years:
Looks like the two metrics have been approaching each other in recent days | Source: CryptoQuant
As you can see in the above graph, the 1m-3m Bitcoin UTXO Age Band has been declining recently, while the 2y-3y group has been observing a rise.
If both the indicators continue going in the current trajectory, then they will soon meet and go through a crossover, where the long-term Age Band will overtake the short-term one.
The quant has also highlighted the trends that followed in the price of BTC when such a pattern previously formed during the past few years.
It seems like whenever this kind of crossover has taken place for the crypto, the price has gone onto see a significant rise in the long term.
The significance of this cross is that it represents a shift in supply from short-term buyers (who are often weak hands) to the long-term holders (strong hands).
It now remains to be seen whether the Bitcoin UTXO Age Bands will go on and complete the cross, and if the same trend as in history will follow now as well.
BTC Price
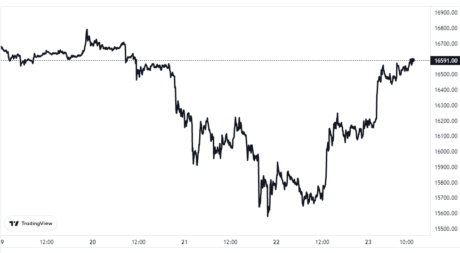
At the time of writing, Bitcoin’s price floats around $16.5k, down 1% in the last week. Over the past month, the crypto has lost 13% in value.

The price of the coin seems to have recovered back above $16.5k during the last 24 hours | Source: BTCUSD on TradingView
Featured image from Kanchanara on Unsplash.com, charts from TradingView.com, CryptoQuant.com
[ad_2]
Image and article originally from newsbtc.com. Read the original article here.

