[ad_1]
On-chain data shows the number of active Bitcoin addresses have remained at a low value for a while now, suggesting there isn’t much demand for the crypto currently.
Bitcoin Active Addresses Have Continued To Move Sideways Recently
As pointed out by an analyst in a CryptoQuant post, the BTC network activity has been low in recent days, implying there isn’t enough demand for a bull rally just yet.
The “number of active addresses” is an indicator that measures the total amount of addresses on the Bitcoin blockchain that have been taking part in some activity, whether that be sending or receiving.
When the value of this metric is high, it means the network is observing a lot of activity right now. Such a trend shows the general interest around the crypto is high among traders currently.
On the other hand, low values of the indicator can suggest the chain isn’t viewing much trading activity at the moment.
Now, here is a chart that shows the trend in the Bitcoin active addresses over the last few years:
Looks like the value of the metric has been quite stagnant in recent months | Source: CryptoQuant
As you can see in the above graph, the quant from the post has highlighted the relevant periods of trend for the Bitcoin active addresses.
Historically, bear markets have observed low and stagnating values of the indicator. The reason behind it is that large declines in the price usually scare away newcomers and short-term traders from the crypto, thus killing off activity on the network.
In the times leading up to bull runs, the market has generally seen a gradual buildup of active addresses, which eventually hit a peak alongside the price. This kind of uptrend signals increasing demand for Bitcoin among all kinds of traders.
Most recently, the metric has been stuck in sideways movement as the crypto has been in the middle of a bear market. There still hasn’t been, however, any sign of the number of active addresses going up yet.
The analyst explains that this recent low demand suggests BTC still hasn’t built up any stable setup for a long-term sustainable rally that can lead to a new bull market.
BTC Price
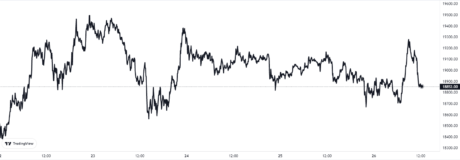
At the time of writing, Bitcoin’s price floats around $18.8k, up 1% in the past week. Over the last month, the crypto has lost 12% in value.
The below chart shows the trend in BTC’s price over the past five days.

Looks like the value of the crypto hasn't shown much movement during the last few days | Source: BTCUSD on TradingView
Featured image from Hans-Jurgen Mager on Unsplash.com, charts from TradingView.com, CryptoQuant.com
[ad_2]
Image and article originally from www.newsbtc.com. Read the original article here.

