[ad_1]
At the end of the Trojan War, Odysseus sets sail to return to his family, his wealth, and his kingdom on the Greek island of Ithaca. The journey should have taken 10 days. Instead, it took 10 years.
Odysseus encounters unexpected challenges on his voyage home. He is captured by a goddess. He battles the Cyclops. He navigates terrifying storms. And while he wrestles with these trials, his rivals back home in Ithaca consume his riches and compete for the affections of his wife.
At the end of the decade, when Odysseus at last reaches Ithaca, he vanquishes his wife’s suitors and secures his wealth and legacy.
My take on Homer’s epic poem? Odysseus would have made a great investor.
Why? Because patience is a virtue in investing. And even when we invest with an outperforming active manager, this virtue is still imperative. That’s the conclusion of our research into what kind of intestinal fortitude it takes to handle the ups and downs that come with actively managed strategies.
Defining Patience and Drawdowns
We
defined patience across three dimensions:
- Likelihood of Occurrence and Frequency: Did the fund experience underperformance? How often did these periods of relative underperformance occur?
- Magnitude: What was the worst relative underperformance over various time periods? What funds experienced drawdowns of particular magnitudes?
- Duration: What was the longest period of relative underperformance, as measured by the length of time between a fund’s peak and its subsequent return to that peak?
Historical Patience Results
So what does a patient investor in an outperforming active equity fund have to endure and what do they receive in return?
To help answer these questions, we analyzed US-domiciled actively managed mutual funds with at least 10 years of returns during the 25 years ended 31 December 2019. The sample included 2,593 funds of which 1,173 outperformed their style benchmark with the median outperforming fund generating almost 1% annualized net excess return.
Overall, we determined that almost all outperforming managers have frequent periods of underperformance relative to their respective style or peer benchmarks. Some of these underperformance periods are large in magnitude and long in duration.
We found that close to 100% of outperforming funds have experienced a drawdown relative to their style and median peer benchmarks over one-, three-, and five-year evaluation periods. What’s more, 80% of outperforming funds had at least one five-year period when they were in the bottom quartile relative to their peers. This is especially important to understand given the results of a 2016 State Street survey of senior executives with asset allocation responsibilities for large institutional investors. The survey found that 89% of these executives would not tolerate underperformance for more than two years before seeking a replacement.
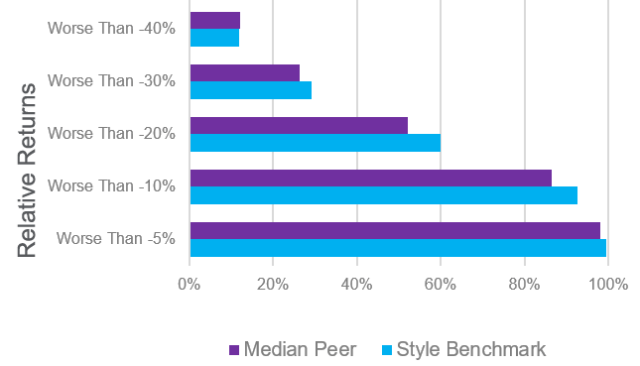
Additionally, some investors lose patience if a manager underperforms by specific amounts. We found that over half of outperforming active equity funds have underperformed their style and median peer benchmark by 20% or more.
Most Outperforming Funds Had Drawdowns Worse Than -20%

Sources: Vanguard calculations, based on data from Morningstar, Inc.
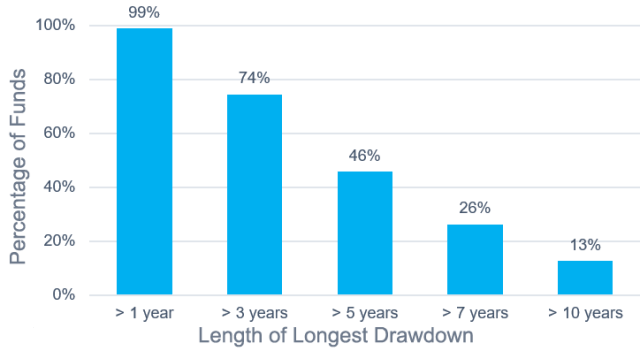
Lastly, of the funds that recovered from their largest drawdown, three-quarters did so after three or more years of underperformance. A quarter of those recovered after more than seven years of underperformance.
Three-Quarters of Outperforming Funds Had Recovery Times Longer Than Three Years

Sources: Vanguard calculations, based on data from Morningstar, Inc.
Investors who understand what to expect and have high conviction and the appropriate risk tolerance are more likely to possess the necessary patience. They will have the capacity to prepare for and tolerate the frequency, magnitude, and length of the drawdowns.
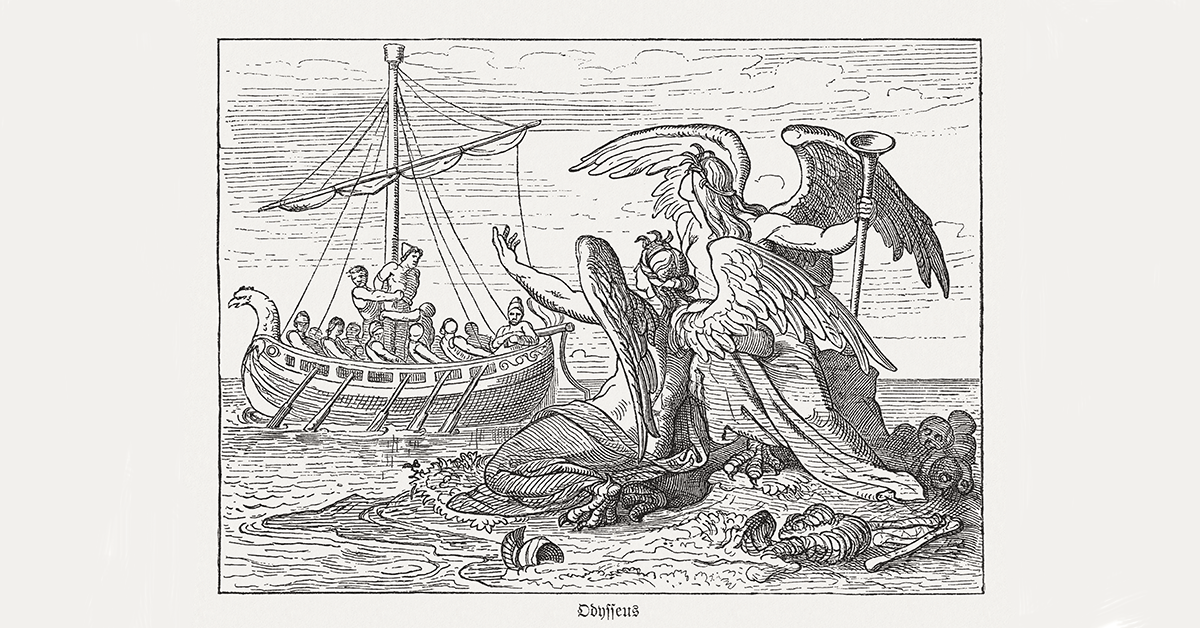
Odysseus, too, battled anxiety and an impulse to respond to short-term exigencies. As he sailed toward Ithaca, the enticing song of the Sirens tempted him to deviate from his course and sought to lure him into a shipwreck. But he had gotten ready: He had his crew plug their ears with beeswax and tie him to the mast with orders not to release him or heed his directions while the Sirens were in earshot. So no matter how much he was enraptured by and drawn to the Sirens’ song, he could not alter course. Odysseus recognized that impatience and panic would lead to disaster for him and his men.
His response is a powerful lesson for investors who seek to outperform with active strategies.
If you liked this post, don’t forget to subscribe to the Enterprising Investor.
All posts are the opinion of the author. As such, they should not be construed as investment advice, nor do the opinions expressed necessarily reflect the views of CFA Institute or the author’s employer.
Image credit: ©Getty Images / ZU_09
[ad_2]
Image and article originally from blogs.cfainstitute.org. Read the original article here.


