[ad_1]
This article is based in part on material drawn from “The Dawn of a New Active Equity Era” by C. Thomas Howard and Return of the Active Manager by C. Thomas Howard and Jason Voss, CFA.
In our 2019 book Return of the Active Manager, we declared that active equity management was alive and well in spite of the recent movement to index investing. We provided numerous ideas on how to improve the evaluation of investment opportunities as well as manage equity portfolios, from the perspective of behavioral finance.
Little did we know that a new golden era of active equity would commence shortly thereafter.
Before we detail the evidence of this return to superior active performance, we first have to address the issue of active vs. passive investing, since it dominates much of the current discussion around equity investing.
Active vs. Passive
It is well established that active equity collectively underperformed its passive counterpart over much of the last 10 years. Some of this underperformance can be attributed to the many closet indexers that are included in the “active” equity universe.
What is not so well known is that active funds have gone through extended periods of under- and outperformance. The graph below, derived from a recent Hartford Funds study, illustrates the cyclical nature of this pattern. From 2011 through 2019, active funds lagged their passively managed peers, as measured by what is considered the most highly efficient market segment, Morningstar’s large blend funds
However, for the 10 years prior, active funds beat their passive counterparts. Moreover, over the last 30 years, active eclipsed passive in 19 out of 26 corrections, which are defined as 10% to 20% market drops.
Rolling Monthly Three-Year Periods, 1986 to 2019

The recent coronavirus market crash was dramatic, resulting in a drop of more than 30% and the fastest descent into a bear market ever. Does this market turmoil presage an extended period of active equity outperformance like we saw after the dot-com bust and the Great Recession? There is good reason to believe so.
The unprecedented 2020 worldwide economic shutdown and the subsequent massive fiscal and monetary stimulus have created extraordinary uncertainty around individual stock valuations. The divergent pattern of equity returns that has developed provides fertile ground for active equity. It is in just such situations that skilled investment teams can thrive.
Active Equity Opportunity (AEO)
Just how favorable is the current environment for stock picking? Three academic studies shed light on that question. They find that both increasing cross-sectional stock dispersion, or the cross-sectional standard deviation of returns from either individual stocks or a portfolio of stocks, and increasing volatility, often measured by VIX, are predictive of higher stock-picking returns. Furthermore, a fourth study demonstrates that high positive skewness plays a major role in portfolio and market performance.
The active equity opportunity (AEO) estimates the impact of market conditions on stock-picking returns by measuring how investors are driving individual stock return dispersion and skewness. Active equity managers prefer a higher AEO since it indicates their high-conviction picks are more likely to outperform. On the other hand, a low AEO implies that even the most talented managers will struggle to beat their benchmark.
AEO estimates are calculated using four components in descending order of importance:
Each component is measured as a six-month trailing average and then converted to a standard normal deviate. These are then combined using average correlations with fund and stock alphas and scaled to a 0–100 range.
The following graphic presents the beginning-of-the-month AEO scores from December 1998 through February 2021. The average AEO over this time was 40, with values greater than 40 indicating a better stock-picking environment.
Active Equity Opportunity, Dec. 1997 to Feb. 2020
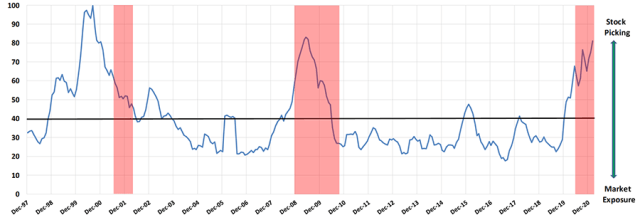
During the nearly 25 years under review, the 1998–2006 and 2008–2010 periods favored stock picking. The 2011–2019 period was bad for active equity. AEO was mostly below average and declined to a low of 18 in mid-2017.
Anna Helen von Reibnitz studied cross-sectional dispersion going back nearly 50 years and finds that the mid-2017 AEOs were among the lowest in a half century. For much of the previous 10 years, stock pickers faced strong headwinds, which in part explains passive’s recent growth at active’s expense.
Since late 2019, however, AEO has spiked and is now at twice its average. The red shaded areas represent National Bureau of Economic Research (NBER) recessions. Based on a 1972–2013 fund sample, von Reibnitz concludes: “Overall, these results suggest that periods of elevated dispersion have a positive effect on alpha for the fund sample as a whole, beyond that coming from recessions.”
We are currently in a recession, until NBER says otherwise, that is accompanied by higher AEOs. This should be ideal terrain for stock pickers.
Passive Growth’s Surprising Impact on Active Performance
In 2019, passive equity mutual fund assets under management (AUM) exceeded active equity AUM for the first time ever. How long will this transition from active to passive last? Will passive funds be the only ones left standing at the end of the day? We do not believe so. Why? for the simple reason that as uninformed passive AUM grows, the stock market will become more informationally inefficient.
Information-gathering active funds have an excellent opportunity to outperform as passive AUM expands. Sanford J. Grossman and Joseph E. Stiglitz argued 40 years ago that some information inefficiency must remain to incentivize active investors to pursue the costly data-gathering process required to make profitable investment decisions. The current passive revolution is thus sowing the seeds for an active equity renaissance.
The more stocks are held by passive investors, Russ Wermers demonstrates, the more informationally inefficient markets become and the greater the opportunities for active managers. Passive fund trades add little market efficiency, Wermers and Tong Yao maintain, since they are driven by investor flows, while information-gathering active funds trade in stocks that are not efficiently priced.
In their study of indexing and active management in the global mutual fund sector, Martijn Cremers and other researchers explain the degree of explicit versus closet indexing as largely the function of a nation’s financial market and regulatory conditions. They also conclude that the more competitive pressure from indexed funds, the more active active funds become and the lower their fees.
Moreover, the average active alpha generated is higher in countries with more explicit indexing and lower in those with more closet indexing. Overall, the evidence suggests that explicit indexing improves competition in the mutual fund industry. The current flow of funds out of closet indexing may mean smaller active vs. passive AUM, but it bodes well for those equity managers who pursue narrowly defined strategies while focusing on high-conviction positions.
As large passive inflows continue, stock mispricing will increase. From the current 50/50 split, the forces driving flows into passive funds will eventually be neutralized by the offsetting increase in stock picking’s appeal. This could result in a roughly 70% passive to 30% truly active split. That is an attractive equilibrium for active equity strategies.
Recent Active Equity Performance
While active equity funds underperformed from 2011 through much of 2019, how have they fared since Return of the Active Manager was published in October 2019?
The annual returns, net of S&P 500 returns, for closet indexers and best active equity funds, along with the returns for best idea or high-conviction stocks are presented below. The best active equity mutual funds pursued a narrowly defined equity strategy and focused on their best idea stocks. AthenaInvest, C. Thomas Howard’s firm, assigns a fund to one of 10 strategy groupings based on its self-declared strategy. The best funds in each strategy are determined each month based on objective measures of strategy consistency and high-conviction equity holdings. (These measures are not performance-based but are gauges of fund manager behavior.)
The reported annual returns are derived from a simple average of the 220 or so best fund subsequent month net returns for each month during the time period under consideration. Closet index returns are calculated in a similar manner. Best idea stocks are those most held by the best funds. Each month features between 250 and 300 best idea stocks. Annual returns are calculated using a simple average of the subsequent monthly stock returns in each month during the period under consideration. This means that a small number of large-cap stocks — the FAANGS, for example — do not disproportionately influence reported returns. In fact, small stocks dominate the best idea universe.
Active Equity Mutual Fund and Best Idea Stocks, Net Annual Returns
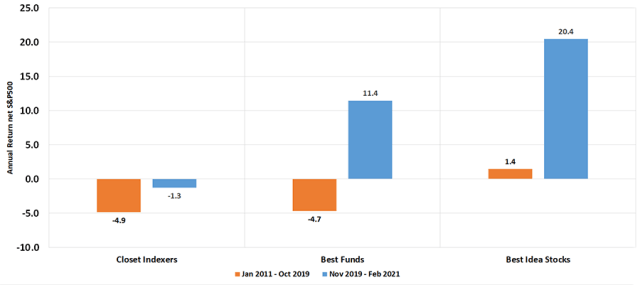
As the preceding figure shows, both closet indexers and best funds underperformed the S&P 500 by nearly 5% from early 2011 to late 2019. Best idea stocks slightly outperform, but if their fees are deducted, they generate returns comparable to the S&P 500’s. So, if an active equity fund had focused exclusively on best idea stocks during this period, it would have matched the market return. Thus, even the best funds must hold a number of low-conviction stocks along with their high-conviction counterparts.
This earlier period, during which AEO was well below its average value, shows how difficult it is for active equity funds to outperform in such markets. A high AEO environment, however, in which emotional investing crowds are pushing stocks away from their fundamental value, sets the stage for stock-picking success.
The later November 2019 to February 2021 period, when AEO was well above average, demonstrates this. Again, closet indexers underperformed the market roughly by their fees. Yet both best funds and best-idea stocks eclipsed the S&P 500 on an annual basis by 11.4% and 20.4%, respectively, as AEO reached levels not seen since the late 1990s. Best-idea stocks outperformed best funds by a whopping 9% annually, which offers further evidence that best funds hold many low-conviction stocks.
This recent performance shines a light on the extraordinary skill of active equity managers when market conditions favor stock picking.
Thriving in the Golden Era
So how can professional managers optimize their performance in today’s high AEO and emotionally charged market environment?
Limiting common cognitive errors will be crucial to success. Investment managers can be single-minded and hardnosed when making buying decisions. After all, they have carefully considered dozens of candidates and invested only in their best idea stocks. But once a stock enters the portfolio, an emotional transformation takes place. It becomes part of the “family.” Heaven forbid it ever goes down. “How could you do this to me!” the manager thinks. “I examined you carefully, even meeting with company management, and this is what you do to me!”
Emotional selling decisions are a problem for professional investors. A 2019 Essentia Analytics paper, “The Alpha Lifecyle,” shows that managers tend to fall in love with their stocks and end up hurting returns by holding on too long and selling too late. The graph below illustrates the paper’s principal results.
Grand Mean of Cumulative Return on ROI over All Stock Time Episodes
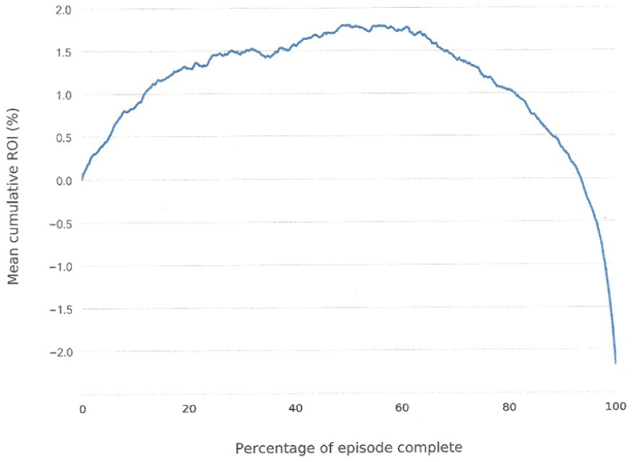
The figure’s initial upward slope shows how the typical manager’s stock-picking talent increases alpha for about 50% to 60% of the holding period. After that, alpha begins to decline and then plummets to negative territory during the holding period’s final 5%. That is, on average, managers grow attached to their stocks and cling to them to the point of smothering the initial hard-earned alpha. Managers should learn to sell before reaching this final destructive stage.
That means developing a circumstances-based selling rule. This is one of the most important emotional adjustments a manager can make to an investment process. Take the emotions out of selling by developing an objective selling rule, preferably before the stock is even purchased. This reduces the potential for cognitive errors around the selling decision and can improve fund performance. Managers should become as deliberate about selling as they are about buying.
Another important consideration is the reliability of the financial data on which equity analysis is based. In “Fraud and Deception Detection: Text-Based Analysis,” Jason presents a unique approach. He invented Deception And Truth Analysis (D.A.T.A.), a computer-based analysis, to study the psycholinguistic/behavioral cues revealed in the 86.5% of financial data that is text-based. In tests of scandal-plagued companies, D.A.T.A. identified indications of deception in all such firms and with an average lead time of 6.6 years. How is this possible?
We have long maintained that behaviors — as revealed in company documents — drive decisions, and, in turn, decisions drive outcomes and stock performance. It takes 6.6 years on average for bad behaviors to be priced accurately by the market and only after a significant lag do they show up in the numbers. This is why it is so important for investors to focus on behavior.
The golden era is here.
Since late 2019, market conditions have turned favorable for active equity funds. Individual stock dispersion and positive skewness, market volatility, and the small firm premium all have increased in recent months. The stage is set for stock pickers to demonstrate their skill.
Given the scale of recent economic and market disruptions, we can expect heightened uncertainty for some time. This makes determining a stock’s fundamental value a challenge that favors expert, heavily resourced professional equity teams.
The current high AEO period also signals increased trading activity by emotional crowds that push stock prices away from fundamental value. The recent GameStop short squeeze frenzy is only the most visible example of these market-roiling trades. This new golden era of stock picking could stretch many months into the future. Professional managers and investors alike should embrace this opportunity for as long as it lasts.
If you liked this post, don’t forget to subscribe to the Enterprising Investor.
All posts are the opinion of the author. As such, they should not be construed as investment advice, nor do the opinions expressed necessarily reflect the views of CFA Institute or the author’s employer.
Image credit: ©Getty Images / Randy Faris
Professional Learning for CFA Institute Members
CFA Institute members are empowered to self-determine and self-report professional learning (PL) credits earned, including content on Enterprising Investor. Members can record credits easily using their online PL tracker.
[ad_2]
Image and article originally from blogs.cfainstitute.org. Read the original article here.


