[ad_1]
Adapted by Lisa M. Laird, CFA, from “Communicating Clearly about Investment Objectives and Risks” by Karyn Williams, PhD, and Harvey D. Shapiro, originally published in the July/August 2021 issue of Investments & Wealth Monitor.1
In the first article in this series, we discussed the need for clear communications at the initial stage of the investment process. We started with purpose and objectives as the bedrock for basic decisions about investment strategy. In this second installment, we identify the communication challenges that accompany traditional investment decision frameworks and such risk concepts as standard deviation.
So What’s Wrong with Traditional Investment Decision Frameworks?
Most sizable institutional investors hire consultants to help the parties involved communicate and evaluate the trade-off between risk and returns. Most use a mean–variance optimization (MVO) framework to help investors make these choices.2 In an MVO framework, the target return is the “mean,” or reward of a portfolio, and standard deviation is the “variance,” or risk. MVO makes the investment strategy decision simple and elegant: Every target return corresponds to an “efficient portfolio” with a risk that is defined by a standard deviation.
But standard deviation fails to characterize risk in a way that matters to most investors. It measures variation in portfolio returns, up and down. But most investors don’t view increases in portfolio values as risk — they care about losing money. They frequently think about returns in absolute terms, and they tend to agree with the adage that you can’t eat relative returns, i.e., returns relative to a benchmark. And although many investors recognize they may face a decline in portfolio value, particularly in any kind of crisis, the major risk in their eyes is to avoid whatever they may view as the maximum allowable loss, also known as the risk capacity or the “loss limit.”
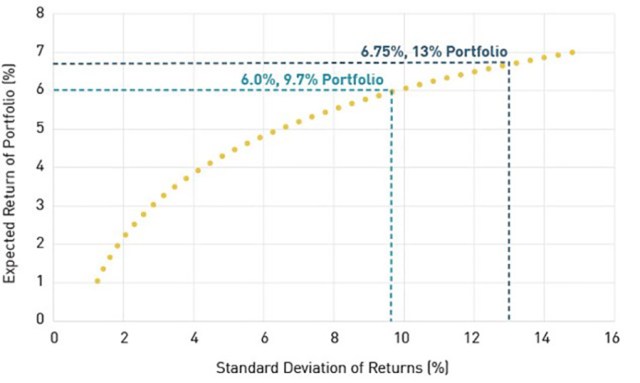
Only by coincidence would an investor’s loss limit ever equal the standard deviation of an MVO portfolio. The following graphic shows a mean–variance frontier, with the highest expected target returns and corresponding standard deviations for two portfolios. For the public foundation with a 6.75% target return, the mean–variance efficient portfolio’s standard deviation is about 13%. In practice, an adviser might translate a 13% standard deviation to a loss level that has a 5% chance of happening, or about 1.65 standard deviations, which in this case is 15%. But what if the investor’s loss limit is 10%? What if it’s 25%? And what if 5% is too high or low a chance of losing 10% or 25%?
Mean–Variance Efficient Portfolios

If the loss limit is 10% and a 5% chance of that loss is acceptable, the foundation’s mean–variance efficient portfolio has a standard deviation of about 9.7% and a lower expected return of 6% (−10% = 6% − 1.65 × 9.7%). This is a very different portfolio. Without translating for the investor, the probability of hitting 6.75% is unknown for this lower-risk portfolio. This makes trade-offs using this framework difficult at best, especially for non-investment professionals.
In any case, standard deviation turns out to be less than fully descriptive of realistic potential portfolio outcomes and the potential paths to those outcomes, and so MVO excludes critical decision information. Most notably, it ignores the potential for very large drops in portfolio value (tail risk), smaller sustained declines in portfolio value (sequence risk), and depletion of the portfolio (depletion risk) over an investment horizon.
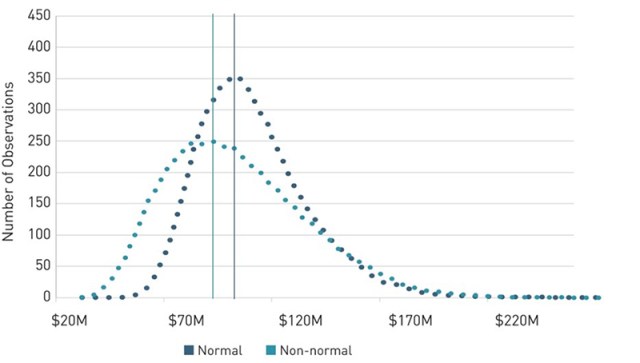
Tail risks come into play more often than MVO assumes.3 The following chart shows potential portfolio values (outcomes) under normal and realistic non-normal asset return assumptions for a $100-million private foundation portfolio with an 8.04% target-return objective. The portfolio’s strategic asset allocation is 30% US equities, 30% non-US equities, 30% US fixed income, and 10% broadly diversified hedge funds. The five-year investment-horizon outcomes for both distribution assumptions reflect the foundation’s strategic allocation and investment activities during the five-year horizon, including quarterly spending, fees, and asset rebalancing. The averages of the outcomes are indicated by the vertical lines.
Distributions of Portfolio Outcomes, Net of Outflows and Rebalancing

The differences in outcomes are material, particularly regarding potential losses. Any decision that excludes this potential for loss can lead to regret, forced selling, unexpected costs, lower than planned cumulative annual growth rates, and depletion.
The table below shows the typical standard metrics used to describe portfolio risks for each resulting portfolio distribution. Decision makers face a challenge interpreting these metrics. If we assume non-normality, is 14% too high a standard deviation? What level of confidence is appropriate for value at risk (VaR)? Generally, such standard metrics do not convey sufficient meaning because they lack context — the specific information that decision makers need to make informed choices about risk.
Standard Investment Risk Metrics
| Normal | Non-Normal | |
| Annualized Standard Deviation | 10% | 14% |
| Five-Year Value at Risk (95th Percentile) | 29% | 44% |
| Five-Year Conditional Value at Risk (95th Percentile) | 33% | 51% |
| Average Drawdown | 11% | 13% |
| Average Maximum Drawdown | 21% | 29% |
Amid this disconnect between standard metrics and investor context, institutions naturally prefer to make vague references, or none at all, to risk in their investment policies. They’ll offer statements such as the following: “Achieve 5% growth plus inflation and expenses over the investment horizon,” “Maximize long-term returns consistent with prudent levels of risk,” “Achieve reasonable returns with acceptable levels of risk,” or “Outperform the policy benchmark by 2% over rolling three-year periods.”
The bottom line is that an MVO approach has serious shortcomings when it comes to risk, and standard metrics are short on meaning. Most importantly, these metrics can lead to poor investment decisions and cause regret.
In the final article in this series, we will explore an alternative approach to enable decision making among competing objectives.
Footnotes
1. Investments & Wealth Monitor is published by the Investments & Wealth Institute®.
2. The MVO framework finds the maximum expected return corresponding to a given portfolio risk level. Typically, risk is defined as the volatility of a portfolio of assets. The framework is based on Harry Markowitz’s foundational 1952 paper.
3. Financial market data exhibit non-normal behavior, including volatility clustering, autoregression, fat tails, skewness, and asymmetric dependencies. For a summary of the stylized facts describing price changes and their impact on securities, asset classes, and portfolios, see “Many Risks, One (Optimal) Portfolio, by Cristian Homescu.
If you liked this post, don’t forget to subscribe to the Enterprising Investor.
All posts are the opinion of the author. As such, they should not be construed as investment advice, nor do the opinions expressed necessarily reflect the views of CFA Institute or the author’s employer.
Image credit: ©Getty Images / aluxum
Professional Learning for CFA Institute Members
CFA Institute members are empowered to self-determine and self-report professional learning (PL) credits earned, including content on Enterprising Investor. Members can record credits easily using their online PL tracker.
[ad_2]
Image and article originally from blogs.cfainstitute.org. Read the original article here.


